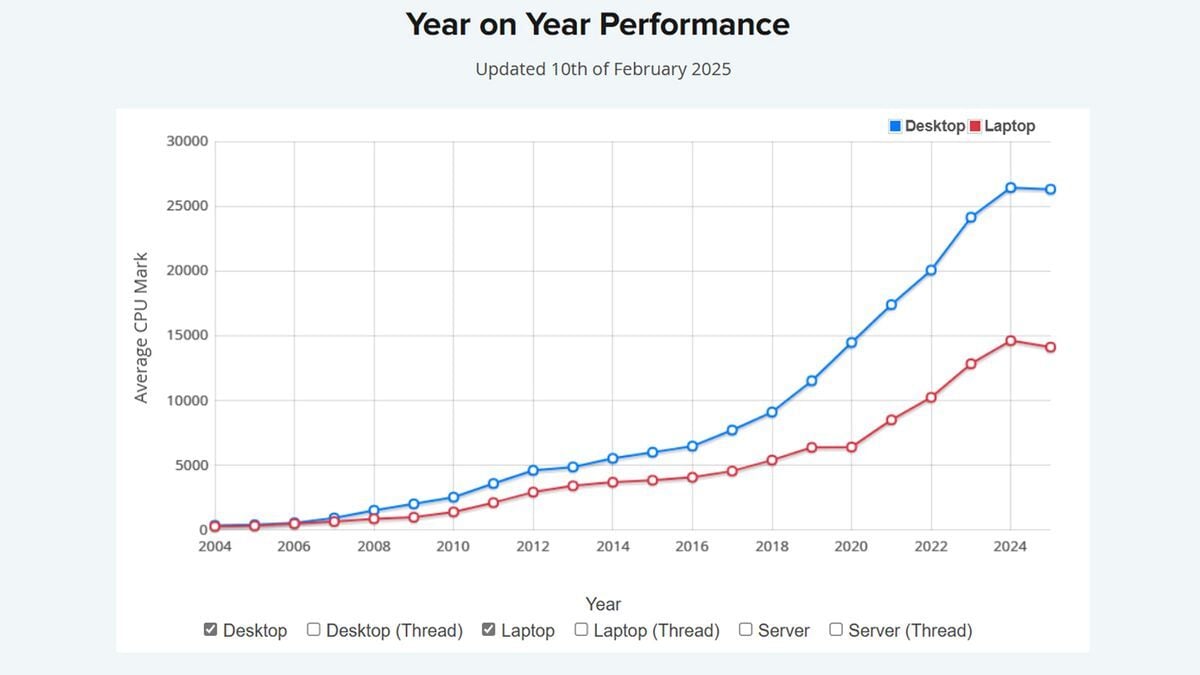
So if I’m reading this right, this is the average performance aggregate of all systems tested year over year.
Meaning, the systems tested this year, as a whole, came out to a lower average score. The top end systems were probably still more powerful, but there could be less top end systems this year, and overall scores were pulled down by the mid or lower ends.
I’d assume this means less people bought the highest end equipment this year compared to prior years. Pricing has gotten extreme for the highest end and I’m betting less people see the value in it with modern gaming being in the state it’s in.
But I’d also be curious what the median is, and how many systems were scored annually.