- cross-posted to:
- [email protected]
- cross-posted to:
- [email protected]
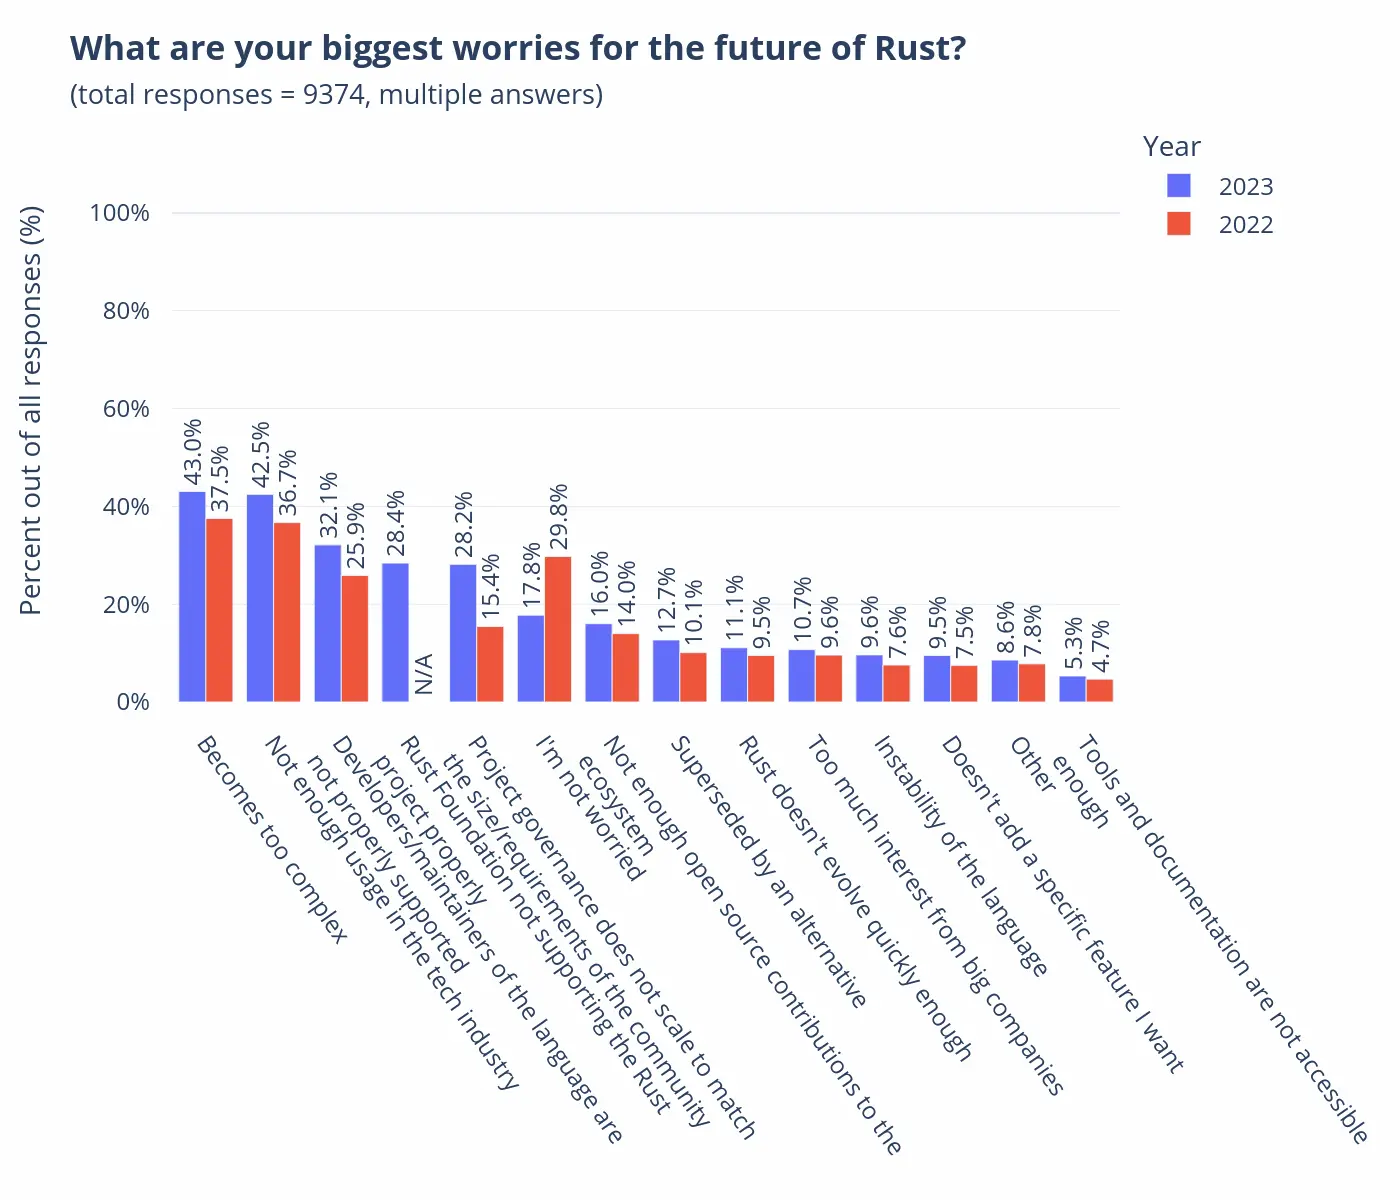
The “what are your biggest worries” graph is, ironically, a little worrying:

Significant increases in “Project governance does not scale to matchthe size/requirements of the community” and decreases to “I’m not worried”. Hopefully this is something that will improve over time as the Rust leadership gets better settled. There was a lot of turmoil with that last year but I think it’s hopefully better now.
deleted by creator
Unfortunately you need to read the paragraph above - only the 14% who answered yes are included. So it’s 26% of those 14%, so it’s more like 3.6%…
However it’s worth noting that there could be women who did not answer yes to the marginalised group question so it’s probably more than that.
deleted by creator
Yeah I don’t think it’s a very good estimate. The vast majority of women I know don’t consider themselves marginalized because of their gender.
Indeed, that number doesn’t tell us much. Even the other categories of the same question are debatable, e.g. political beliefs and language.
It would have been better to simply put the checkboxes there and have an extra question about being discrimated against
Wow, that was not at all clear. I was shocked that 50% of respondants identify as LGBTQ; 7% is a much less surprising figure.


