

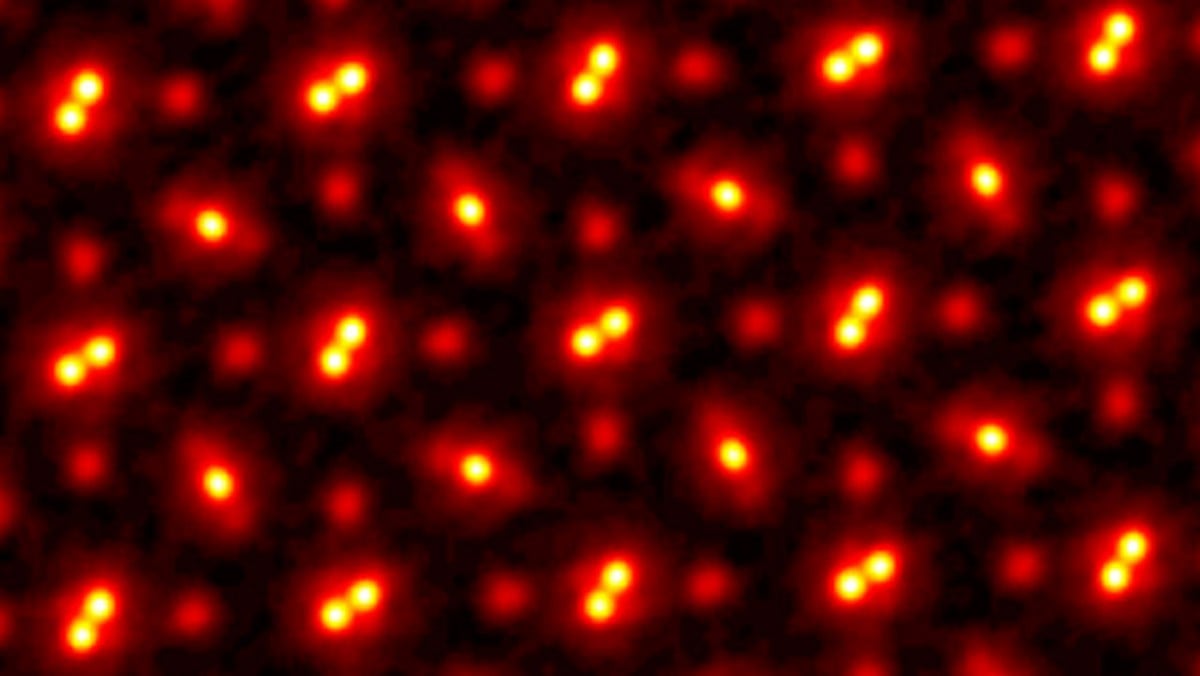
They say it’s a picture of atoms, but what are the atoms: the glowing yellow balls or the entire meatball including the darker red? If it’s the meatballs, then why do some have apparently two nuclei?
Here’s the public press release: https://news.cornell.edu/stories/2021/05/cornell-researchers-see-atoms-record-resolution
Here’s the actual scientific article: https://www.science.org/doi/10.1126/science.abg2533
You must log in or register to comment.
The brighter spots are the nuclei of the Pr, Sc, and O atoms, which are reflecting the electrons of the scanning beams (because they’re comparatively much heavier).
The space in between the nuclei is where the electrons from all of the atoms are. Because the atoms are bound as PrScO3, the electrons are shared and not really part of any one particular atom or other.
Technically all of it is “the atoms” because the electrons are part of the structure as much as the protons and neutrons.
This diagram in the article is helpful:

The drawing in the lower right shows how the atoms are arranged. The double spots are the nuclei of two Pr atoms very close together. The slightly fainter, elongated spots are actually ScO2 that is arranged as O-Sc-O. The fainter single spots are the other O nuclei that fill out the PrScO3 structure.
That is only sort of true - this image is not made of electrons reflected by the nuclei. These are results from TEM imaging, so Transmission Electron Microscopy. The electron detector is placed behind the sample.
What you are describing is SEM - Scanning Electron Microscopy - in that case, the detector can be placed above the sample, for example (but not limited to) circularly around the beam to measure the backscattered electrons
In TEM the samples are cut into very thin slices (in the picture you posted it is said to be between 0.8nm - 30nm) and the crystal lattice acts as a diffraction grating for the electron beam. The diffraction pattern can be then used to reconstruct the crystal lattice structure.
So the spots are the nuclei and not the electron cloud? Wow! This is waaaaay smaller imaging than i was thinking it was!
This picture shows the influence of the nuclei, not the nuclei themselves. The nuclei are much smaller. If you throw an electron at an atom, the nucleus will change that electron’s direction even if it doesn’t hit it, just by being close.
The yellow areas are the ‘shades’ of the nuclei, but do not reflect their actual size. The lattice constant of the crystal according to the figure is 59 pm = 59 e-12 m, which is the horizontal or vertical distance you see between two of the Pr couples. The actual size of a nucleus would be of order ~ 10 fm = ~ 10 e-15 m.
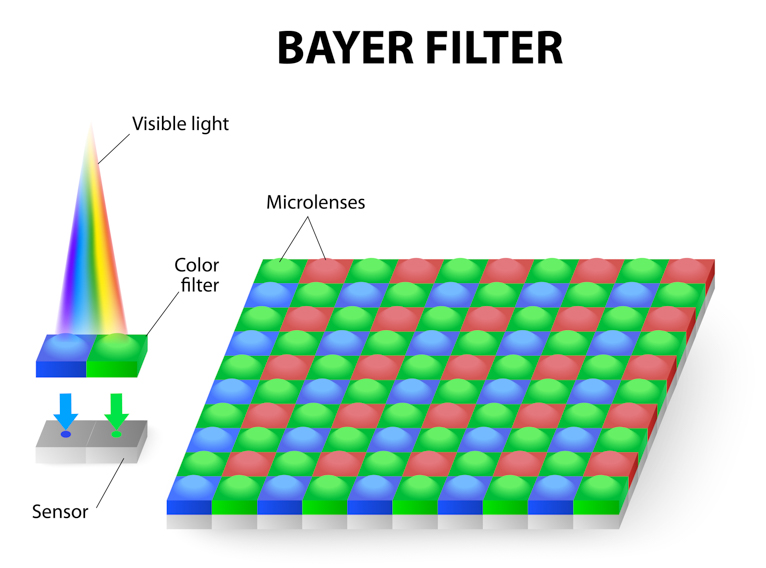
So, this image was made with a scanning electron microscope - actually several arranged in a grid somewhat similar to a digital camera sensor. Basically the way this works is that a beam of electrons (kind of like a laser, but electrons instead of photons) is fired at the material being scanned. The electrons bounce off of anything heavier than they are, such as the protons and neutrons in the nucleus (electrons are about 1/2000 of the mass of a proton). Some of the electrons bounce back into the detection grid of the microscope.
So the bright spots are where the electrons bounced off of the nuclei back into the detection grid. You can’t really get an image of an electron cloud with an electron microscope because electrons are all the same mass, so if you hit one with another one they both move away in random directions (hitting one billiard ball with another). Comparatively hitting a proton with an electron isn’t strong enough to move the proton very much (hitting a house with a billiard ball).
I should also say that this is a simplification because protons, neutrons and electrons don’t really exist as physical ball-shaped particles, but as probability waves. Arvin Ash gives the best explanation of this that I’ve seen.
The upshot of all that is that the bright spots in the image show where the protons and neutrons of the atoms were most likely to be during the scanning (it’s really difficult to talk about anything absolute at this scale, everything is probabilistic).
Also yes, this image is a very tiny area, literally a few atoms across. It’s very impressive, and it basically amounts to visual proof that what we believe to be true about molecular bonding is true because the picture actually shows what the theory predicts.
Bro must’ve written the article
Nah, I just read a lot of quantum mechanics stuff because the world we live in is complex and sort of illusory from this point of view and I think it’s fascinating. I do recommend the Wikipedia article on the standard model of particle physics and this video by AlphaPhoenix about using a scanning transmission electron microscope.
Looking at that diagram, it would be really cool if they could use a second beam to generate a 3D image that you could explore in VR.
Each of the orbs are the atoms. The brighter orbs that are nearest each other at the Praseodymium (Pr) atoms. The single orbs are the Scandium (Sc) atoms and the less prominent orbs are the Oxygen atoms. I believe based on the content of the article.The space between is just that, the space between the atoms. They are all in a lattice pattern due to how they are attracted to each other.
I have a followup question: When scientists are taking these images, are they just static snapshots or does the technology to see them doing their thing in real time exist? Are they even actually “pictures” in that sense, or are they just representations of things we can’t actually see?
These images are generated from processing many out of focus images while scanning across the area. They use the differences between the out of focus images to compute what must have caused those differences.
So this technique is pretty far from being able to capture real time events as it requires capturing hundreds of images to produce a single computed image. The paper talks about how thermal motion of the nuclei is what now dominates the limits of resolution for this method.
There are other ultrafast imaging techniques that can capture essentially real-time chemical reactions, but I believe those don’t come close to this spatial resolution.
Not 100% comparable, but synchrotron XRD allows for real-imaging of solid state chemical reactions and can, in a sense, resolve the unit cell structure of the crystal. However, what you get from an XRD is nothing like this “photo-like” image, but a diffractogram. I think you could probably re-create an image like this from a 2D diffractogram though, but I’m not sure.
I could be wrong, but I think XRD requires very pure crystals of sufficiently large size. That can help you ascertain the structure and composition of something you can synthesize and crystalize, but I don’t believe xrd can image specific regions of interest like single doping sites like this article talks about.
Synchrotron XRD also has a major drawback in having a very significant equipment requirement that requires being able send samples away for analysis at a dedicated facility. That puts limits on sample preparation and stability time, as well as sharing beam time with lots of other groups.
It’s been a while since I’ve read up on synchrotron xray diffraction though, so there could be workarounds for some of those limitation or I could be misremembering details.
You’re definitely correct that getting sychrotron time is hard :(
On the first part though: Yes and no. XRD will tell you about things like strain and unit cell size distribution, so in that sense, you can’t resolve a single doping site. On the other hand, if you have a reaction going on, or some dopant diffusing into your sample, synchrotron XRD is powerful/fast enough that you can “film” how the crystal structure changes in real time. That “film” will be a kind of average of many sites, but can still be focused to a relatively small region (don’t remember exactly how small off the top of my head, but I believe we’re talking nm-scale).
Atoms are almost entirely empty space. And electrons themselves don’t really occupy a specific dot in space, they’re more of a blur that fuzzes out in a “large” region of space around the nucleus. So what’s shown here is most likely a visualization of the area that the electrons occupy.
But I’m no physicist and i didn’t read the article, so take this with a big grain of salt
EDIT
Another person here said the round things are actually the nuclei, and they sound like they know what they’re talking about. So while the informational stuff i said is right, it might not actually be a description of the image we’re looking at
deleted by creator
they are the eyes of all the hot MILFs in your area waiting for you to show your credit card to them
deleted by creator
“The high–spatial resolution phase image of Fig. 2A is borne out by quantitative analysis. In real space, the Pr–Pr dumbbells with a separation of only 59 pm are resolved with a contrast of 63% (Fig. 2B), which is better than the 73% contrast for two point objects separated at the Rayleigh criterion. Therefore, the Rayleigh resolution of the image is much better than 59 pm. Nevertheless, the exact resolution can be determined only after considering the finite atomic size instead of assuming point objects (28). We can also resolve the O–Sc–O triple atom projections, even though the light O atoms are only 63 pm (26) from the heavier Sc atoms “
They are looking at a crystal lattice of PrScO3
Saying the same thing as the text doesn’t help anyone.
It helps those that know how to read the text… It clearly states that those are Pr-Pr dumbbells in the PrScO3 lattice that you are seeing. Also, you should be seeing some O-Sc-O triplets, but I didn’t look for them.
This is a picture of a crystal of a molecule made up of three different types of atoms.
I’m too tired to help you more, right now, sorry.
OP specifically asked:
the glowing yellow balls or the entire meatballs.
I’m sure if OP understood the text, this wouldn’t have been asked.
Indeed.
I gave the OP the benefit of the doubt that it didnt know where to look in the article for the description of the image.
Will stop trying to help, sorry.
Can someone explain what the various parts of this picture of atoms are?
You didn’t do any of this. You just were condescending to the OP. It doesn’t help people to be more interested in Science.
Good thing you stopped “helping.”
Edit: Sorry if I sounded aggressive. I see that you replied to a different comment and appreciated their simpler explanation.
I will definitely wait until i see that there are actually 0 replies after a day before I reply to anything science related.
I dont feel welcome here and good bye.
Or you could just accurately answer the question. This community is called “AskScience” after all. Then use the links or excerpts from the papers or articles as a backup.
To put it in English, each blob is an atom, the thing as a whole is a crystal lattice of praseodymium orthoscandate (PrScO3).
In the article, figure 1d and 1e annotate the image to tell you exactly which part is which. The bright pairs are Pr-Pr, the single bright blobs with wings are O-Sc-O, and the dimmer blobs standing alone are O.
By my count that means each repeating section has two Pr, one Sc, and four O, which doesn’t add up to me, given the chemical formula PrScO3. But maybe that’s because they’re arranged in three dimensions and we’re only looking at two. I haven’t read the full article.
Thank you for that

