

- cross-posted to:
- [email protected]
- cross-posted to:
- [email protected]
cross-posted from: https://floss.social/users/LabPlot/statuses/112484470459165421
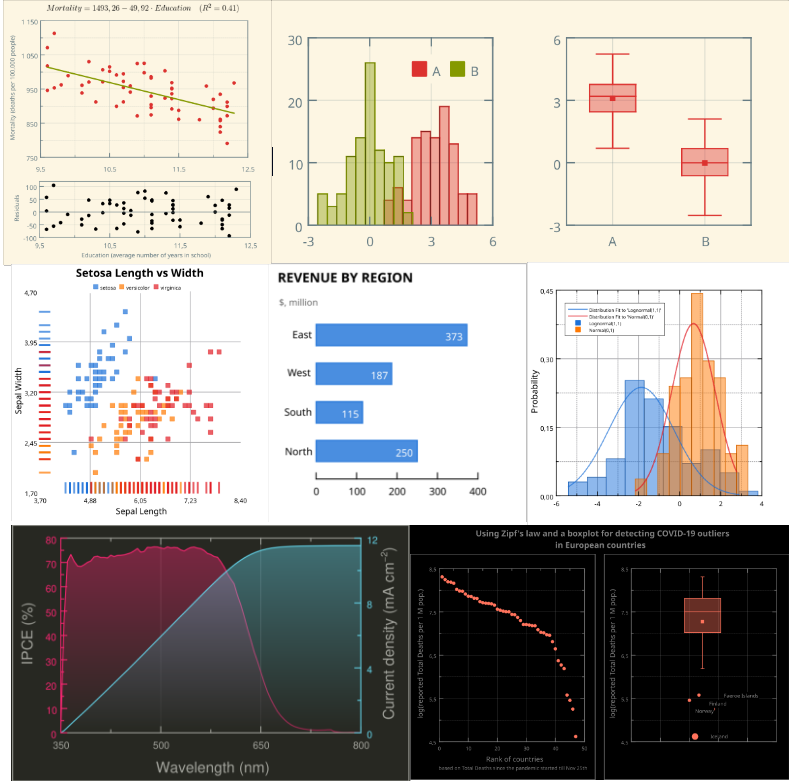
Below is just a small sample of plots that were created with #lLabPlot.
#LabPlot is a FREE, open source and cross-platform Data Visualization and Data Analysis software.
Would you like to share with us your plots made in LabPlot?
#DataAnalysis #DataScience #Data #DataViz #DataVisualization #Science #Statistics #Mathematics #Math #STEM #FOSS #FLOSS #OpenSource #KDE
You must log in or register to comment.
This looks amazing. I was actually looking for a foss plotting software but could not find anything. Will have a look at this
R tidyverse (specifically ggplot) is used by pretty much everyone in the scientific field. Probably the only implementation of a plotting system that has the least friction.
Gnuplot would usually be the first that comes into my mind. However, it’s command line only.
Labplot does not only have a GUI, it also integrates well into the KDE desktop environment.
I use R, btw ;)
This is neat.
I like the Unix idea of doing one thing. But that was also kinda the issue with Labplot. R can also do conversion, table operations etc.
Excel is very easy to use with no learning curve. But it is of course bloated Microsoft nonsense.
Hi there! Looks like you linked to a Lemmy community using a URL instead of its name, which doesn’t work well for people on different instances. Try fixing it like this: [email protected]
It would be great if it had some grammar of graphics embedded in the UX
What kind of plot was used for “setosa length vs width”?


