- cross-posted to:
- gay
- cross-posted to:
- gay
You must log in or register to comment.
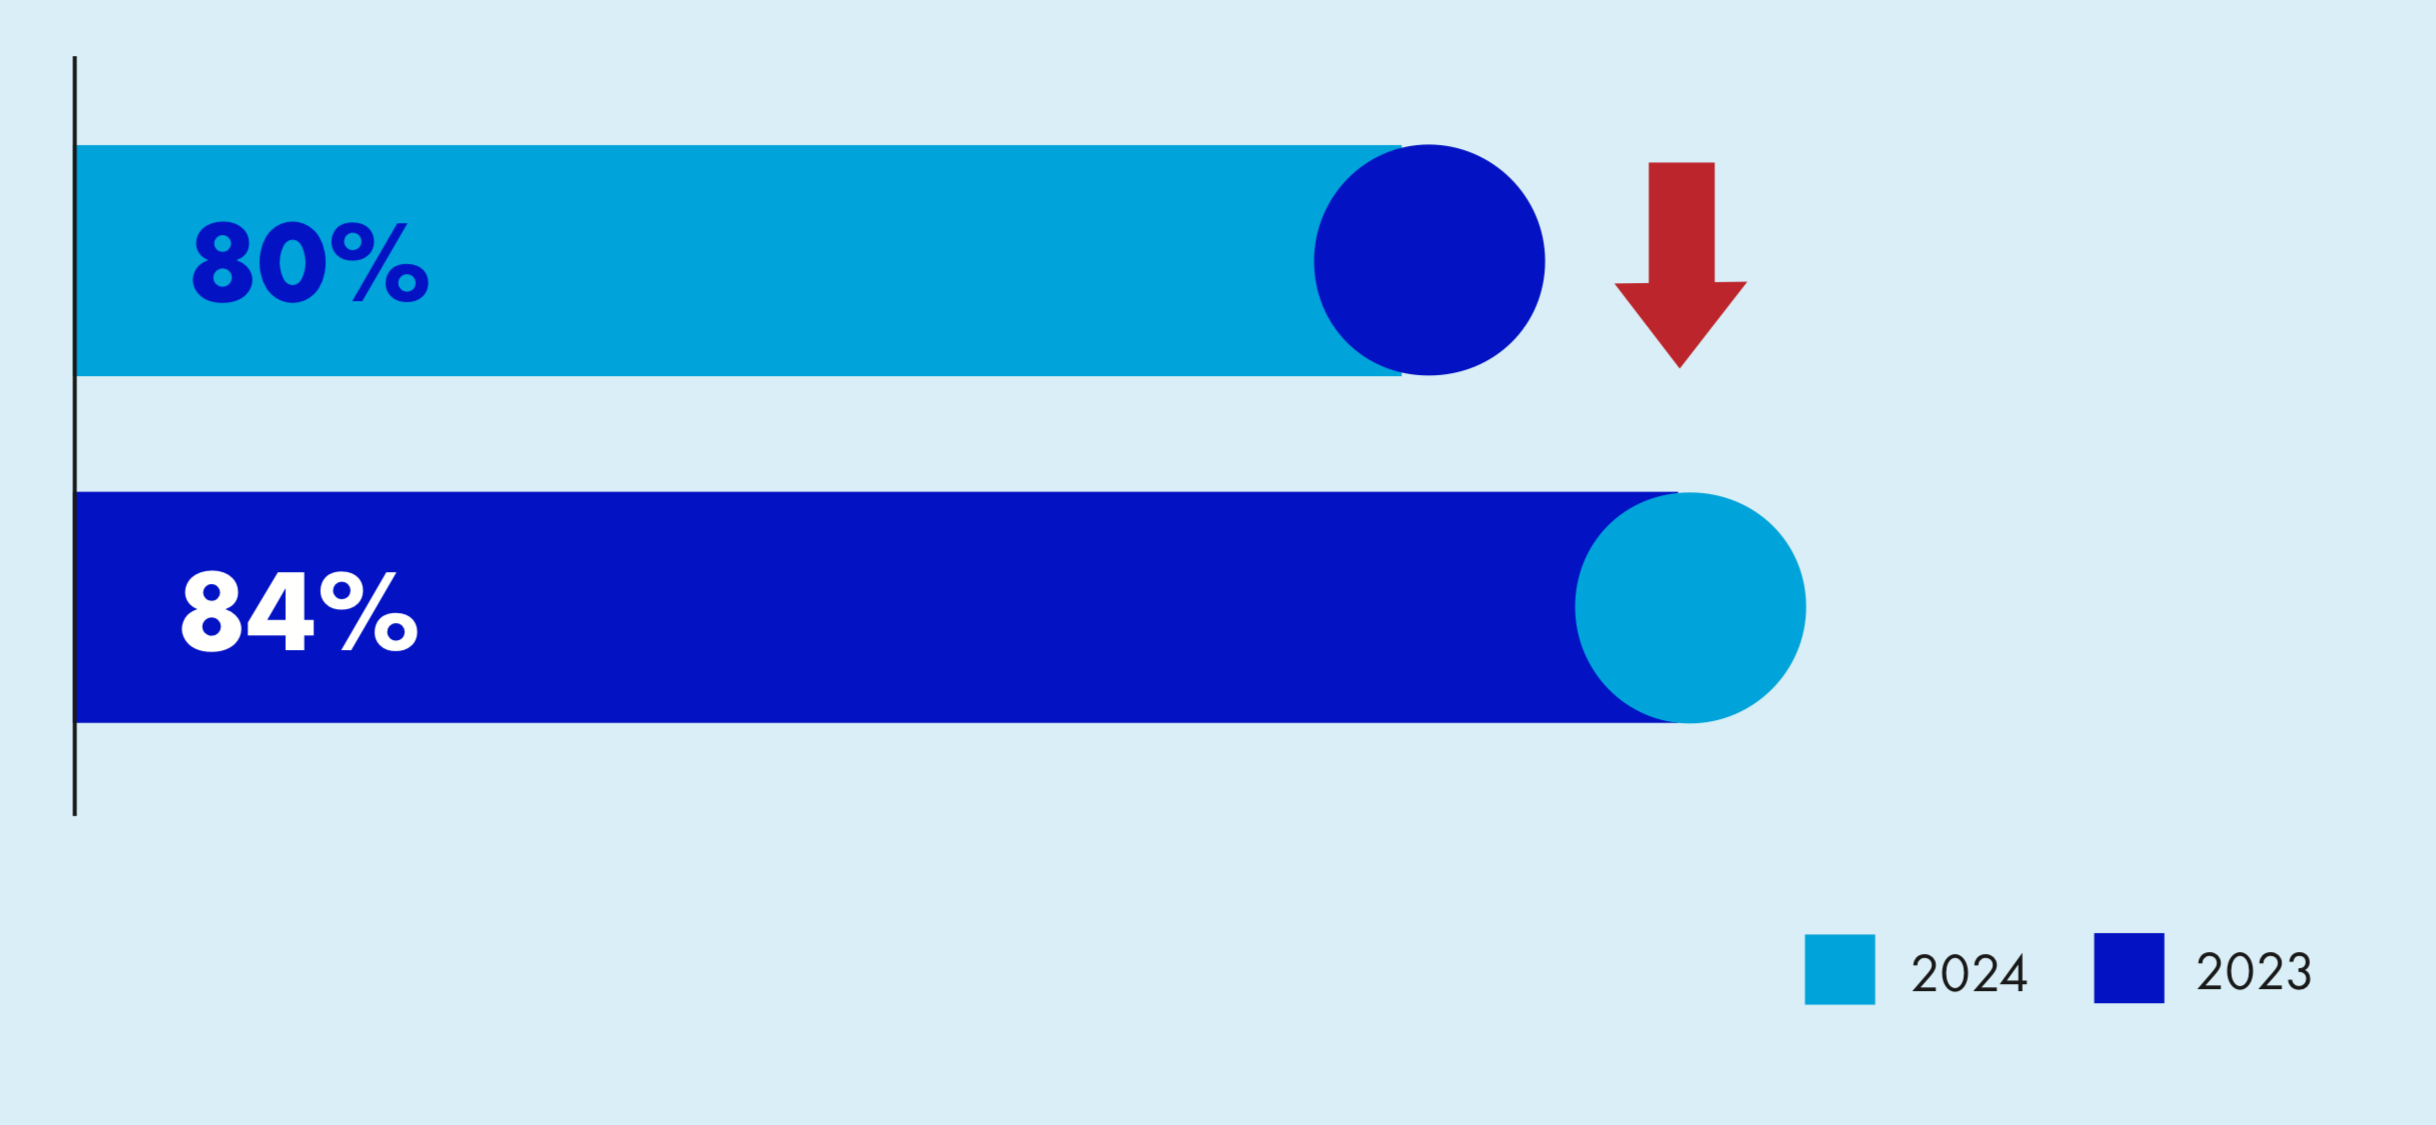
The specific question was “I support equal rights for the LGBTQ community”
- 2021: 79% said yes
- 2022: 81%
- 2023: 84%
- 2024: 80%
Seems early to assume an actual decline. 2023 might have been weird. Election years might be weird. Who knows? But it is worth keeping an eye on.
Side note: If your chart has two years, and an assigned color for each year… Don’t use both colors for both bars.

If not for this specific case being tied to some text about going down from 84 to 80, I would not have been able to understand the rest of the charts.
Also not mentioned in the article at all: the polling error.
While a 4% shift could be significant, I’d also bet that the error bars of the two polls overlap.


