
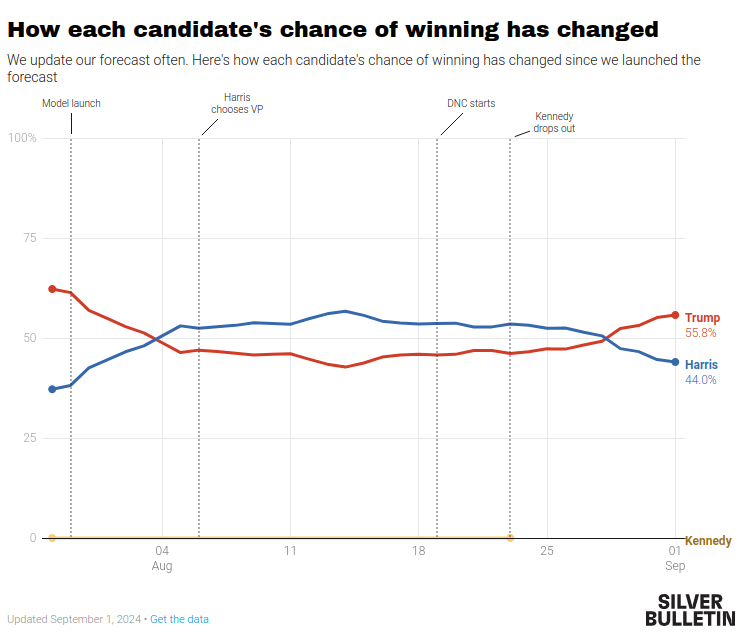
Silver’s model showed Harris having a better chance of winning the election between August 4 and August 27, although Trump’s chances have been on the rise for a week. Last Wednesday, Harris and Trump’s forecasts were relatively tied at 50.5 percent to 49.2 percent, respectively.
This week’s forecast gives Trump his greatest chance of winning reelection since Silver’s model was launched on July 30, when he was given a 61.3 percent chance. At that time, Harris had a 38.1 percent chance of victory.
You must log in or register to comment.
Maddening that a layup election is coming down to the wire because nobody in our govt can be fked to enforce the Lehey Laws.
Well, it was. Now I’m resigned to the fact that it’s us. We’re the bad guys. If they can justify genocide they can justify anything. Now all those cop cities make sense. No matter who wins. This whole thing is gonna end badly for all us here in the imperial core. The Rot is too deep.
Appealing to Republicans works so well! Who needs progressive votes anyways?
This is disinformation. Nate silver has directly called out the use of that screenshot.
https://www.natesilver.net/p/theres-no-normal-in-this-election
For instance, we’ve seen cases of people using this chart to imply that we have Donald Trump forecasted to win the election by 10 or 11 points. The biggest landslide since Reagan in 1984! But that’s not at all what this chart is saying. Rather, it displays the probability that Trump will win the Electoral College — which is about 55 percent in our forecast, compared to about 45 percent for Harris.
I’m not seeing any disinformation on Linkerbaan’s part. Linkerbaan posted the chart with its correct title.
Removed by mod
That’s not at all what that article says.
6 upvotes and nobody that read your article.
Including yourself of course.