
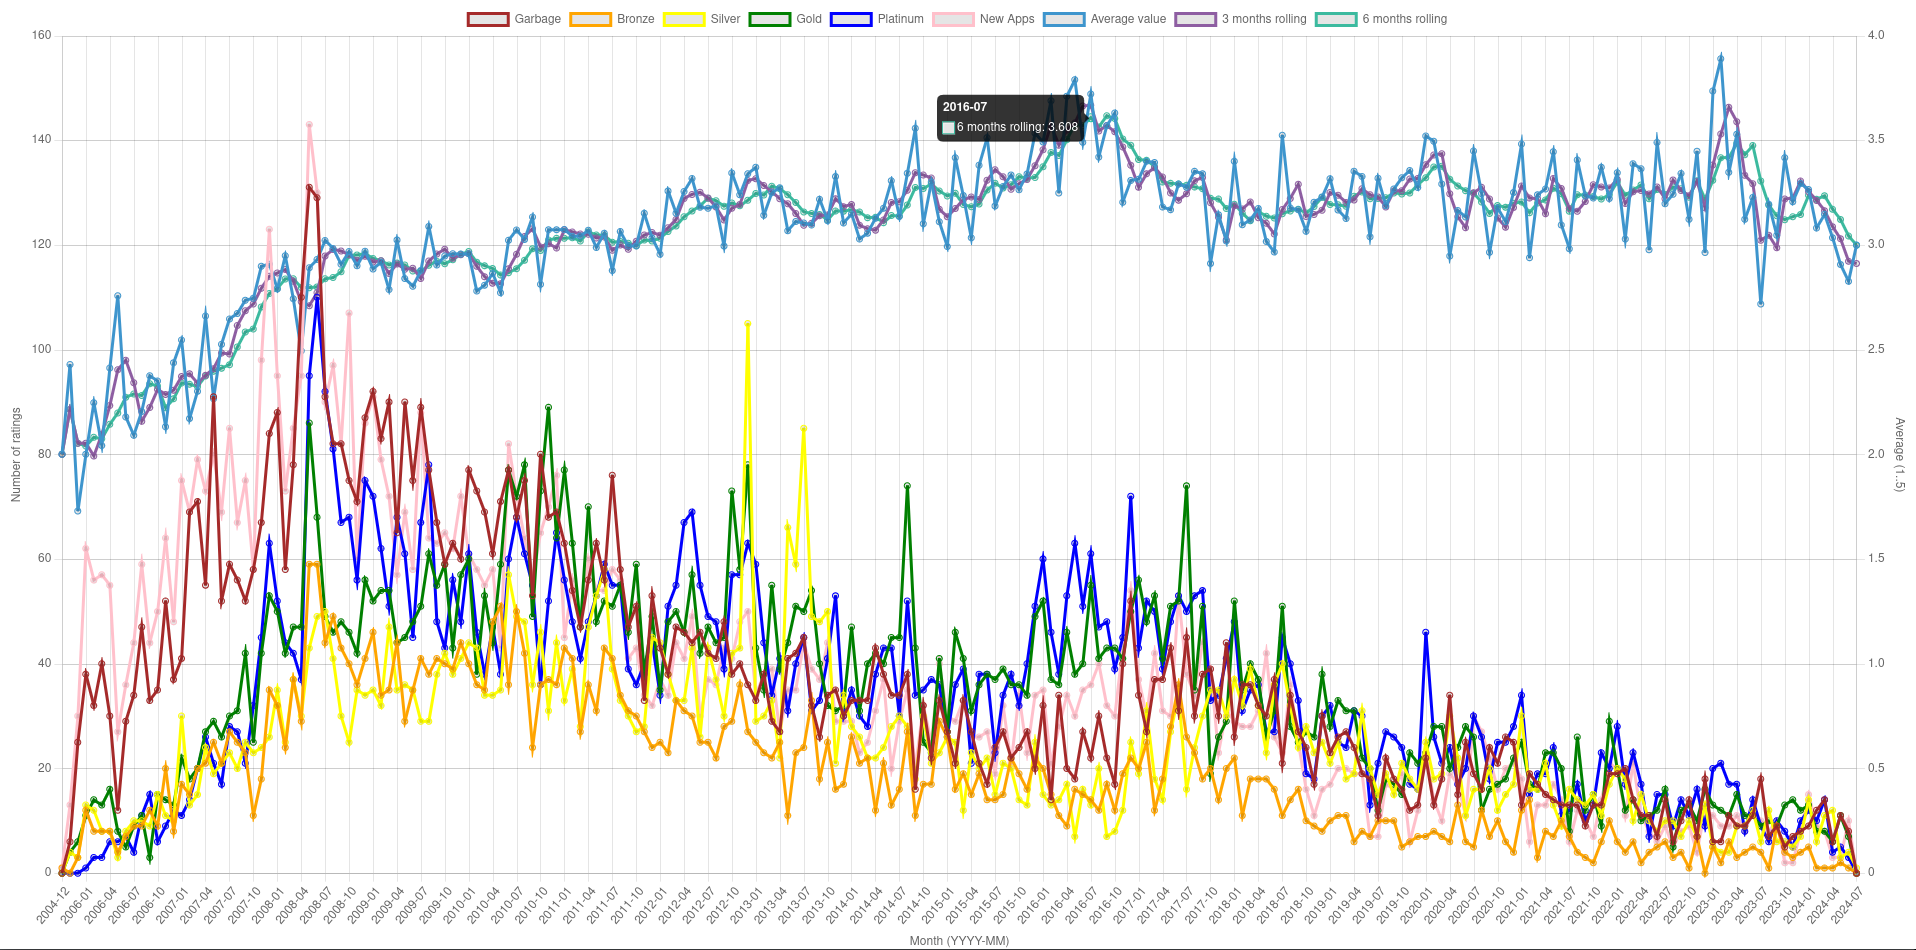
I took each rating for games on Wine Application Database, mapped them to numbers (Garbage -> 1, Bronze -> 2, Silver -> 3, Gold -> 4, Platinum -> 5) and plotted a monthly average.
I took each rating for games on Wine Application Database, mapped them to numbers (Garbage -> 1, Bronze -> 2, Silver -> 3, Gold -> 4, Platinum -> 5) and plotted a monthly average.
The left axis is total number of ratings of each type (Garbage, Bronze, Silver, Gold, Platinum) in a given month (not per app). For example for month
2016-07there were"Garbage" => 22 "Bronze" => 14 "Silver" => 13 "Gold" => 55 "Platinum" => 61On right side is the average rating. So if I assign values to each rating:
  "Garbage" => 1
  "Bronze" => 2
  "Silver" => 3
  "Gold" => 4
  "Platinum" => 5
I can get an average rating, which will be between 1 to 5.
((22*1) + (14*2) + (13*3) + (55*4) + (61*5)) / (22 + 14 + 13 + 55 + 61)
 ~=  3.721