

Whether former swing states, captured ex-solid states, or states that have always had close margins. I picked 7 for each side(I was gonna do 3, then 4, then 5, but the number on one side always felt awkward like one side had a weird outlier edge case or something. Pink has a clean base of 4 while Cyan has two main ones and then like, 5 is the next one where it all fits)
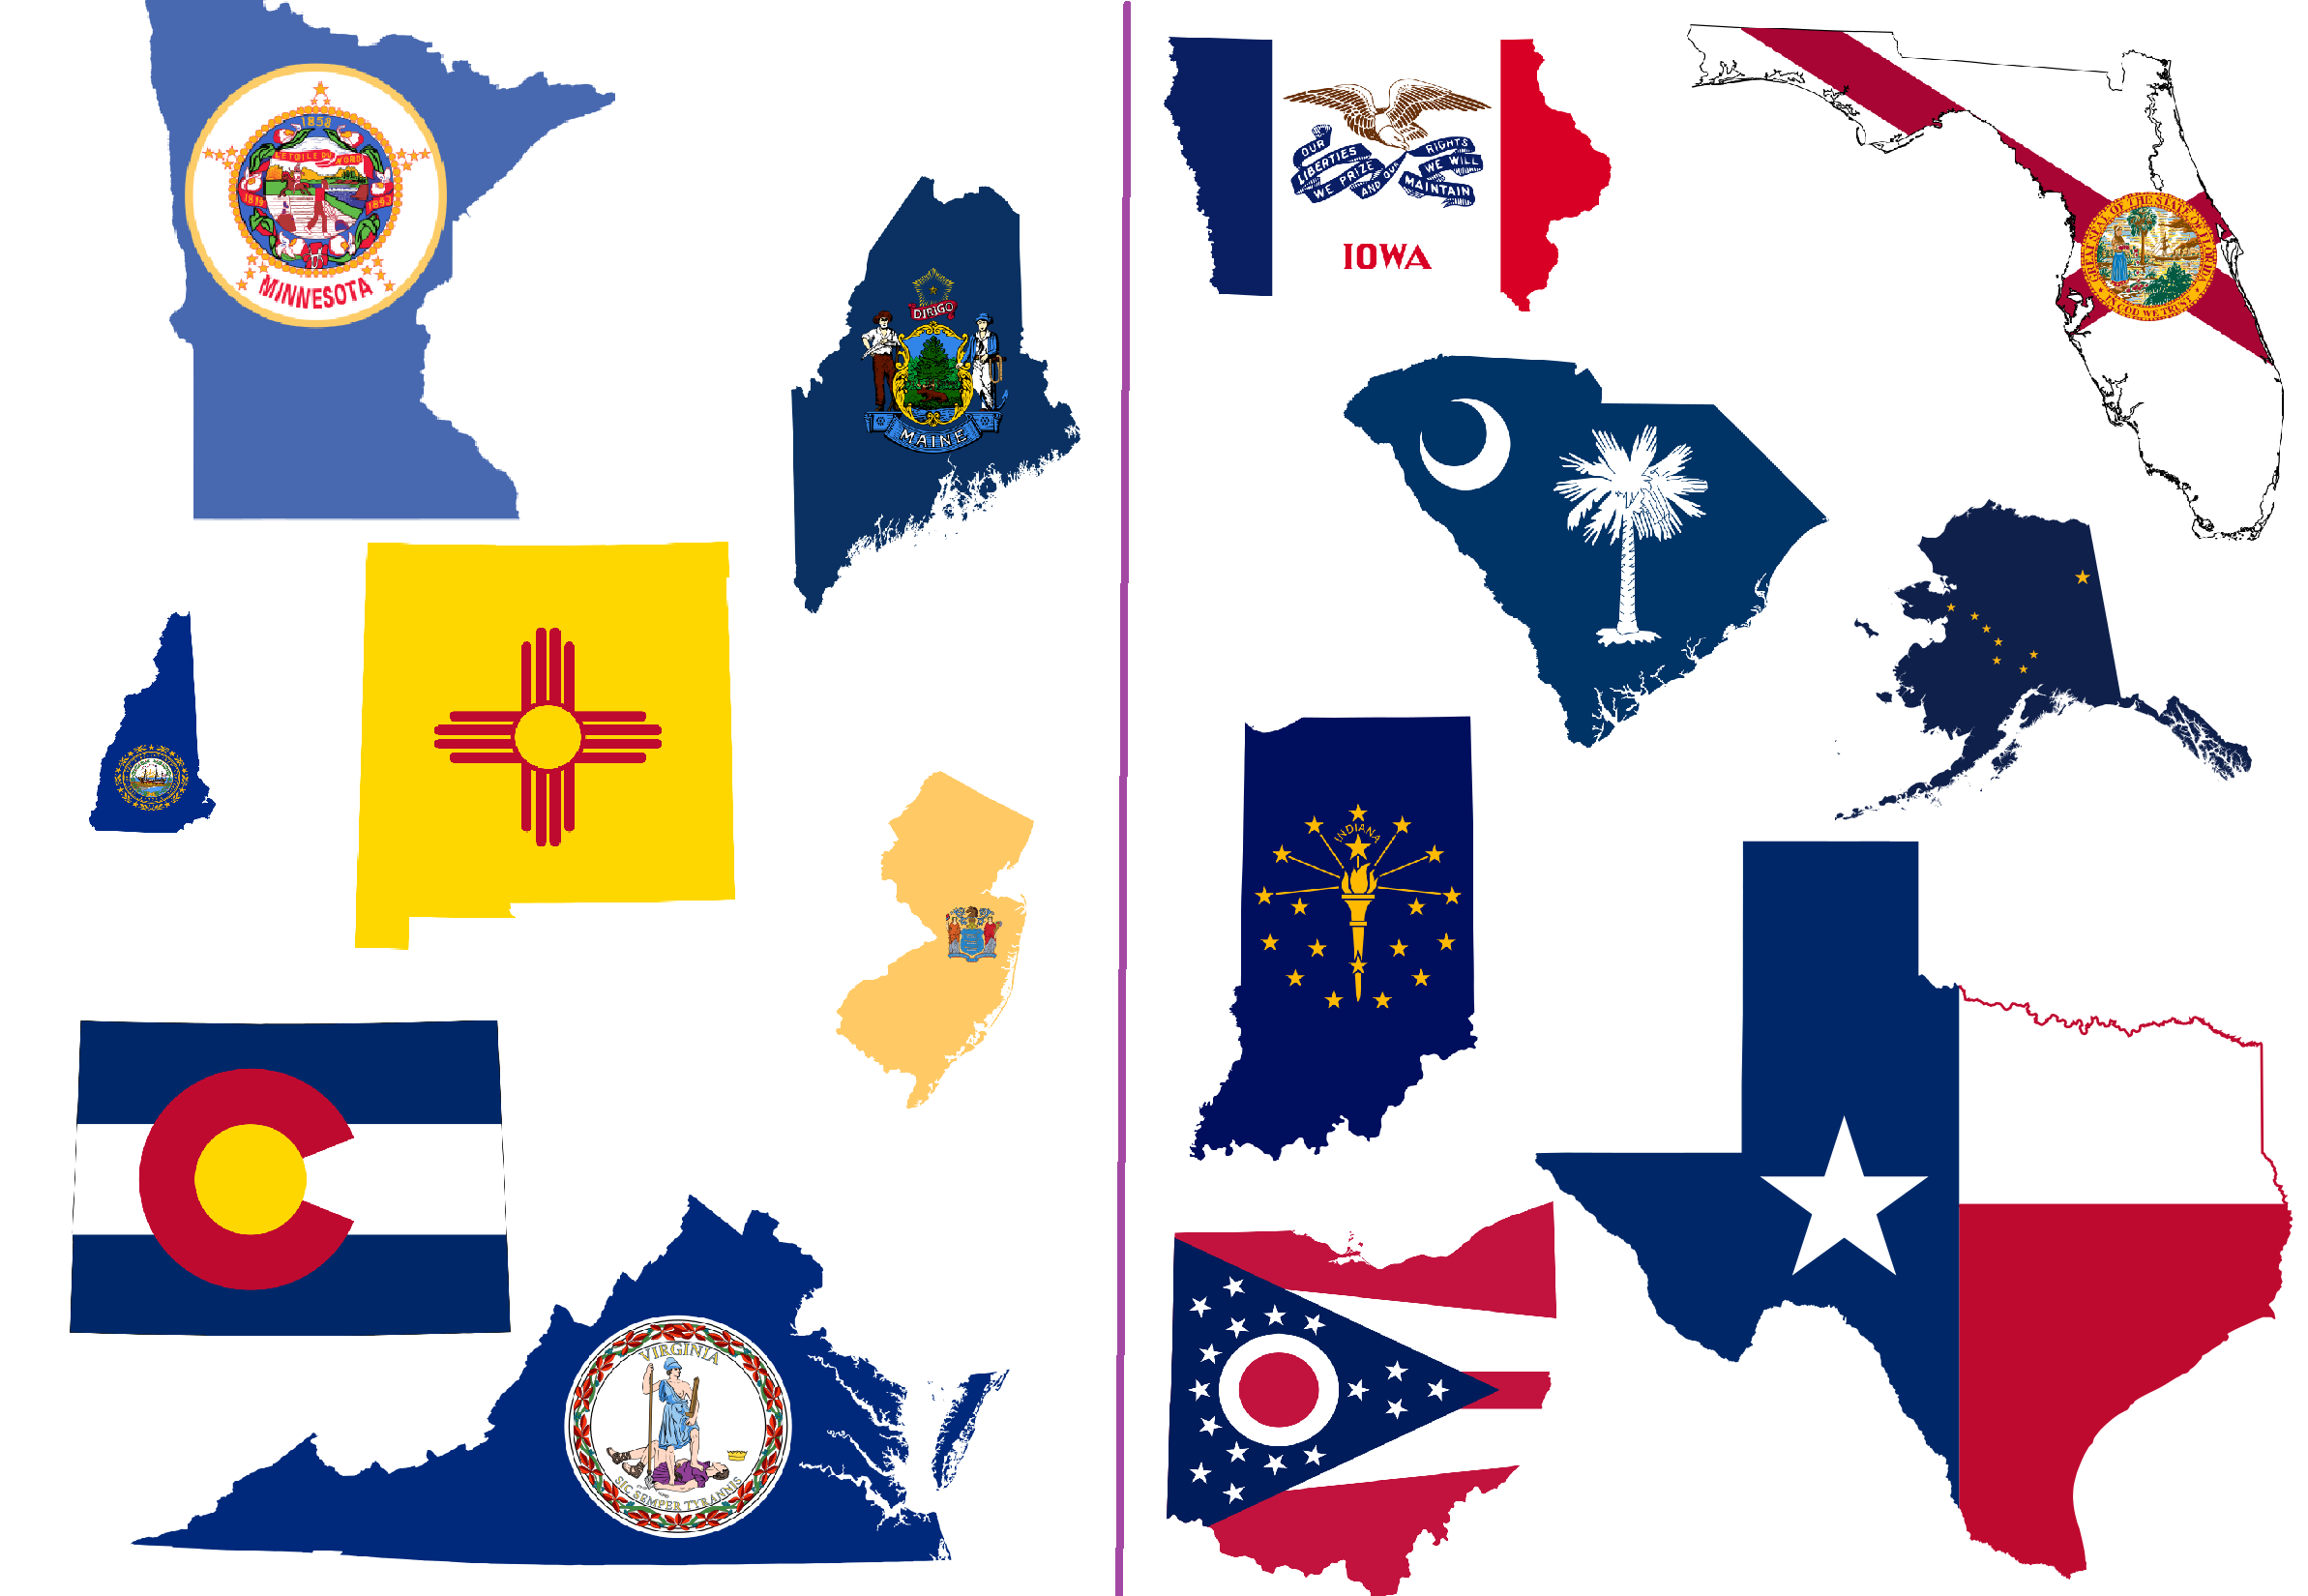
Pink States are Iowa, Ohio, and Florida(former Swing States in the 2000-2016 era), Texas, South Carolina, and Alaska (Red States weakening) and Indiana(2008 pick up that’s been red before and after).
Cyan States are Virginia, New Mexico, Colorado, and New Hampshire(former swing states in the 2000-2016 era), plus Maine and Minnesota(perpetually teetering states) and New Jersey(Blue state weakening).
Ok I read up again.
From what I can tell, Virginia’s redness peaked in 2001(let’s say around 9/11 during the brief spike). It stayed red in the 1990s even against Dixiecrat Bill Clinton. (Though it was relatively stagnant politically from 1998-2001, sort of a plateau)
From that point on it gradually slipped blue. Blue Govna in 2001, midterm losses, more midterm losses, eventually going Blue for Obama. It went from just over 7 points redder than the rest of the country in 2000, to under 6 points redder in 2004, to less than a point and a half redder in 2008, to basically dead even with national in 2012. (IE: Had Romney won a tight victory in 2012 he’d likely carry Virginia by extremely tight margins, after that it was out of play). This trend continued with it being 4 points bluer than the nation in 2016 and 6 points bluer in 2020.
However the increase from 2016-2020(while it looked big on paper, 5 point jump) isn’t actually as big when you look full picture. Namely accounting for third party and Biden’s better national performance and regional performance, 2020 was closer to a 1 point increase. (And in these elections with high third party 2016 and mail in 2020 it’s important to note). I’d actually argue 2018 is around the peak of the trend as they saw solid blue gains that basically finished off hopes of it being a swing state. This is our reverse 9/11 inflection point. 2020 may have been a bit stronger even with everything factored in then 2016 was, but we likely peaked this hill in 2018. Trump was also just generally a point behind generic R there.
2021 showed this with a Republican Governor upset. Sure, he was a popular R without super strong Trump ties and his opponent wasn’t the most well liked, but it shows the trend altering. 2022, Virginia went red seat wise, R gains. 2023, blues barely hold a district and no gains. Now it’s polling comparably if not slightly redder than Michigan.
If we’re comparing 2017-2018 when it was declared solid blue to 2001-2002 ‘sea of red era’ we’re in late 2007-early 2008 territory right now comparison wise. Obama flipped Virginia blue back then. Trump isn’t Obama(as I said, it was still redder than the national average in 2008 and about the same in 2012, a winning Republican wins those years, albeit any winning democrat wins it in 2012 and 2008 they needed to just be an above average democrat which Obama was). So even by that trend it would seemingly be safe blue this time and 2028 would be the danger zone.
BUT, the third party situation comes up again. Namely it’s utterly changed massively, Bush 04, the Obama years, and Trump 2016 saw third party compositions that heavily favored democrats by mostly taking from Republicans. That’s changed this year for the first time since 2000. (mostly due to RFK wiping out the small right coalition and the Libertarians having a internal conflict). Account for that in the math and it’s more like reversed 2010-2012 numbers. It favors blue, but not by much. We’re in Michigan level territory which isn’t quite safe.