
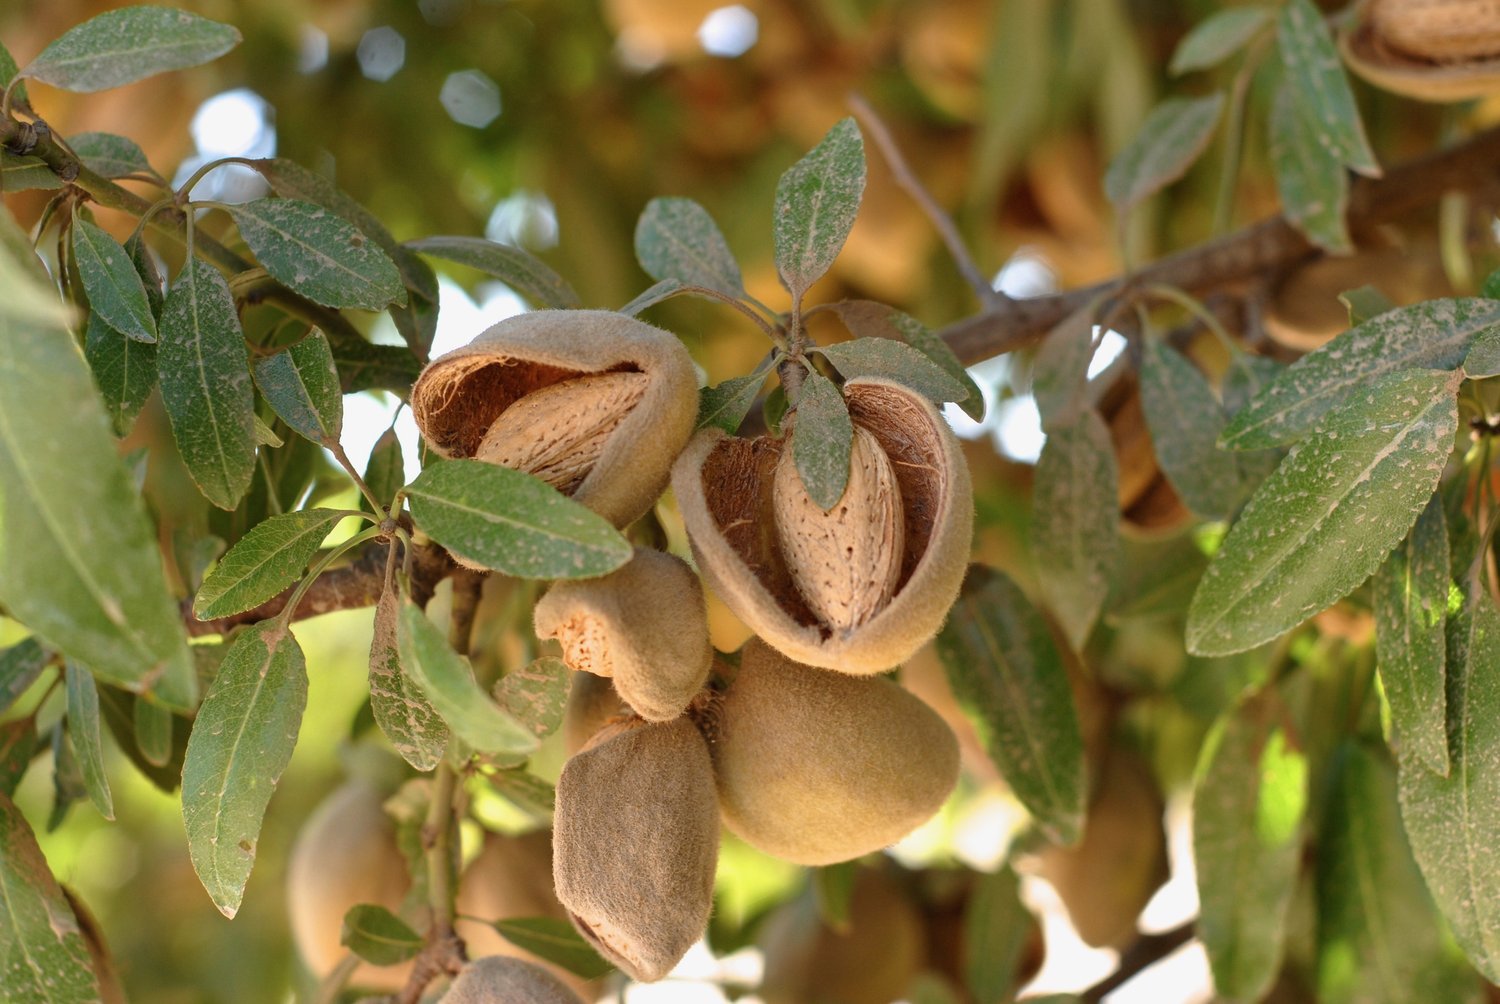
70% of those almonds are exported. But you should take a pathetic dribble of a shower.
For those who don’t know, the flow restriction plug can be removed from most shower heads. But you didn’t hear it from me.
70% of those almonds are exported. But you should take a pathetic dribble of a shower.
For those who don’t know, the flow restriction plug can be removed from most shower heads. But you didn’t hear it from me.
https://www.cdfa.ca.gov/statistics/
It kind of seems like a lot of dairy is exported. Dairy was valued at $10.4 billion, Cattle and Calves: $3.63 billion, Almonds: $3.52 billion. I mean, unless California is consuming over 70% of $14 billion in cattle and dairy products, but exporting all the almonds.
You can click the export stats. Almonds are #1 export, followed by dairy. Dairy exports were about $2B out of $10B produced. So roughly 75% of dairy is not exported.
Well, I did a little analysis and almonds sure are a consumer of water in California, but I’d encourage you to look into the water, land use and emissions impact of cattle and dairy, I know, you are worried about exporting away all your water, but there are larger impact agricultural products and you said everything should be scrutinized more, so here is more scrutiny.
tl;dr: In 2022, California used this much water on these agricultural products: Almonds: 9 billion m³ Beef: 20 billion m³ Cheese: 4.4 billion m³ Butter: 1.3 billion m³
This doesn’t factor in other dairy products because the data doesn’t line up well enough to compute and I’m just some internet user, so what do I know?
Anyways land use is crazy, beef alone used 1 million acres, while all other field crops used 627 thousand acres. (Source: cdfa stat review)
2022 1000 pounds metric ton m3 water usage Almonds (with shell) 2565000 1163476.36759503 9362494330.0372 Butter 685953 311146.239680668 1346018632.85857 Cheese 2460538 1116092.71523179 4402985761.5894 Sour Cream 199309 90405.9693368412 Yogurt 377839 171386.646103602 Milk Nonfat 860246 390205.02585503 Milk condensed 108237 49095.9811303638 Dry Buttermilk 60090 27256.6451964075 Ice Cream 77939 35352.8984849859 Lowfat Ice cream 36140 16392.9964619432 Cattle Calves 2197765 996899.664338202 20154320513.9254 Water use (m3 /ton) green blue grey total Milk 647 60 89 796 Butter 3519 324 483 4326 Milk Powder 3007 277 413 3697 Cheese 3196 310 439 3945 Almonds (with shell) 4632 1908 1507 8047 Beef 19102 525 590 20217 References: https://www.cdfa.ca.gov/Statistics/PDFs/2022_Exports_Publication.pdf https://www.cdfa.ca.gov/Statistics/PDFs/2022-2023_california_agricultural_statistics_review.pdf https://www.waterfootprint.org/resources/Report-48-WaterFootprint-AnimalProducts-Vol1.pdf https://waterfootprint.org/resources/Report47-WaterFootprintCrops-Vol1.pdfblue water I could drink. cows make green water available to me.