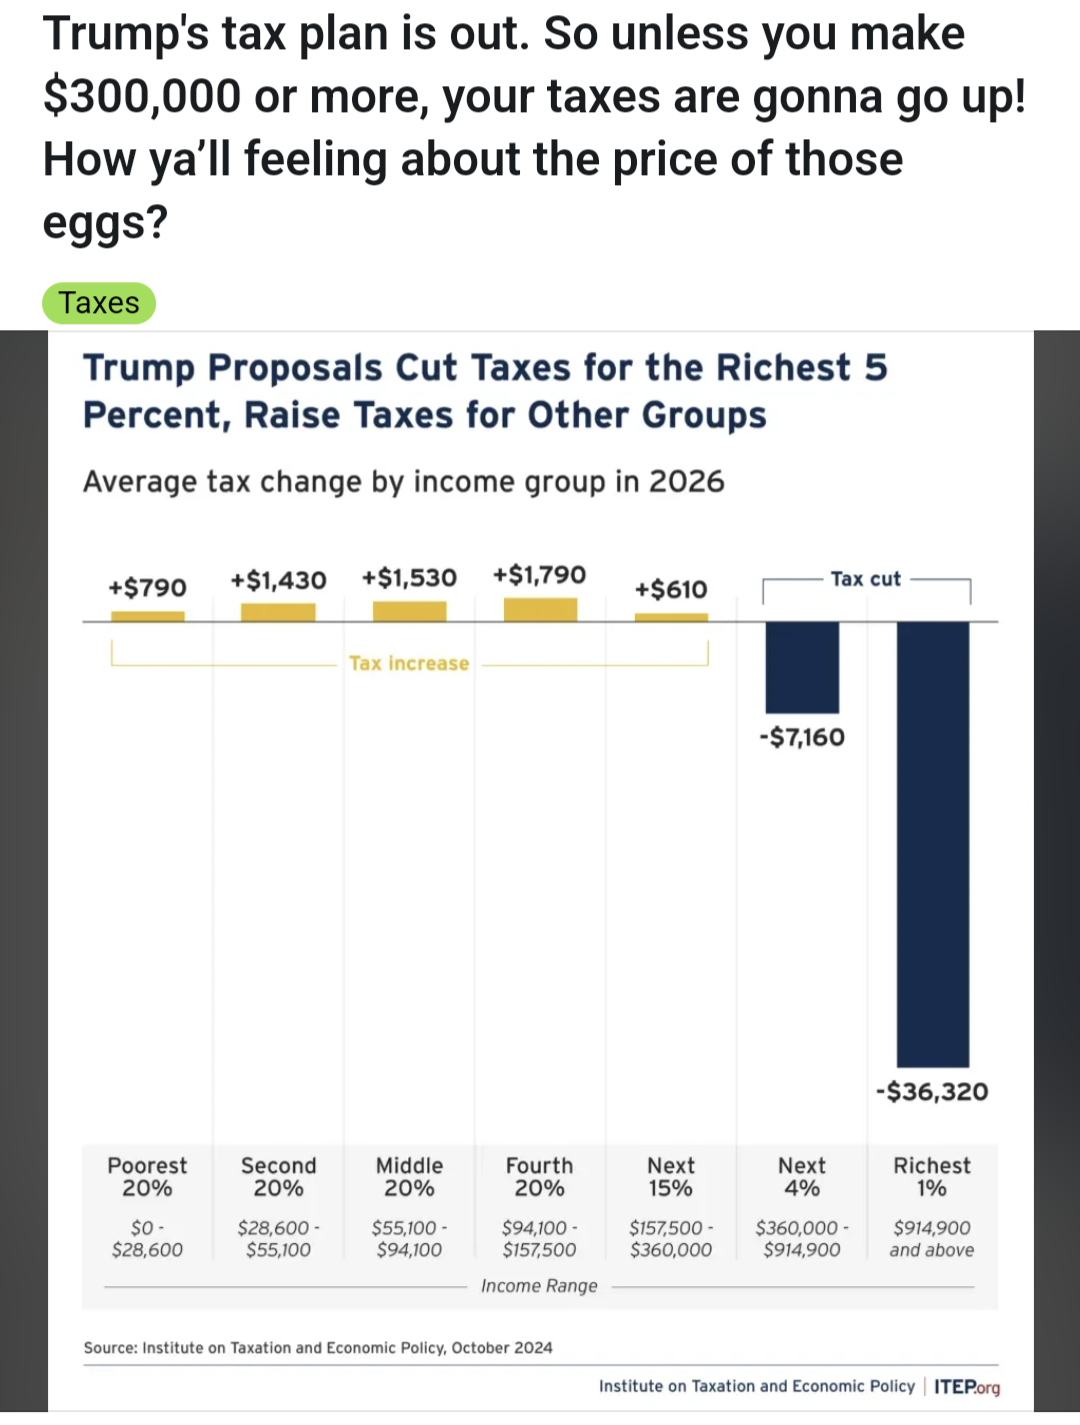
If you look at “breakdown of tax propoals by category” note that it doesn’t account for inflation, for example giving a reduction to everyone for tax cuts. But in the real world, that’s not how it works. Tax cuts that are paid for with deficit spending like these are essentially zero-sum because the price of everything will have to increase to account for spending power. So in other words, it’s even worse for everyone but the 1% than indicated.
Graph is from October 2024 this isn’t some new version that was just released either
Correct. And it is still current.
https://itep.org/federal-tax-debate-2025-trump-tax-changes/#collapseOne
If you look at “breakdown of tax propoals by category” note that it doesn’t account for inflation, for example giving a reduction to everyone for tax cuts. But in the real world, that’s not how it works. Tax cuts that are paid for with deficit spending like these are essentially zero-sum because the price of everything will have to increase to account for spending power. So in other words, it’s even worse for everyone but the 1% than indicated.