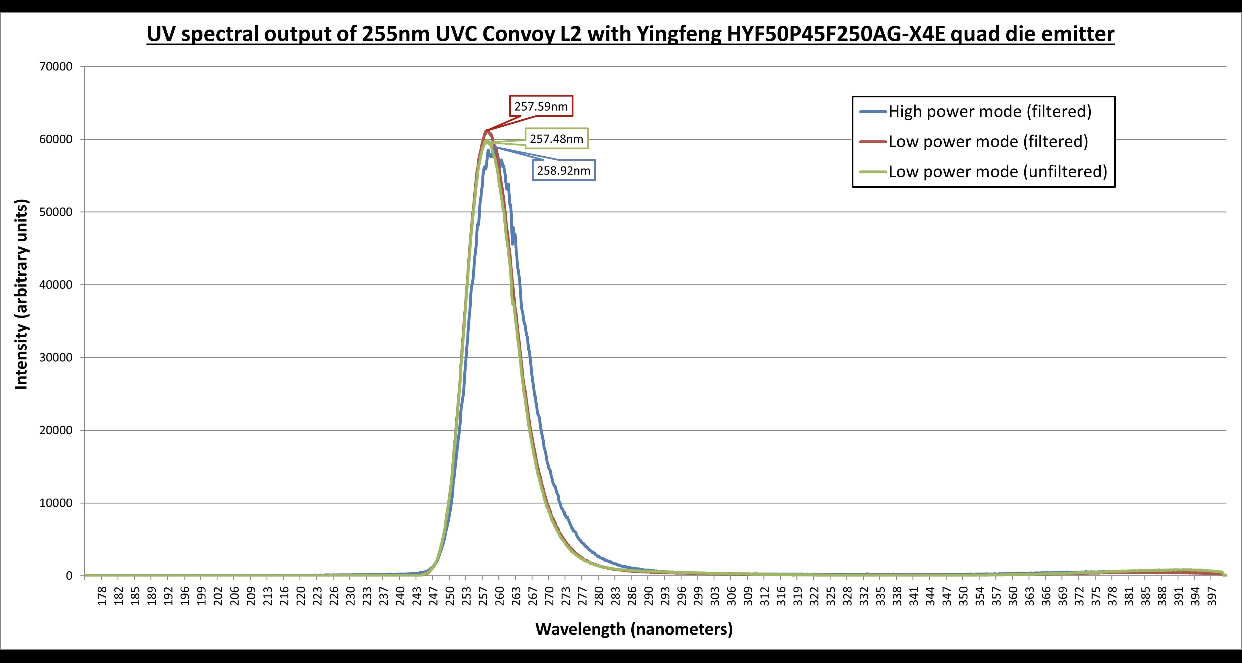
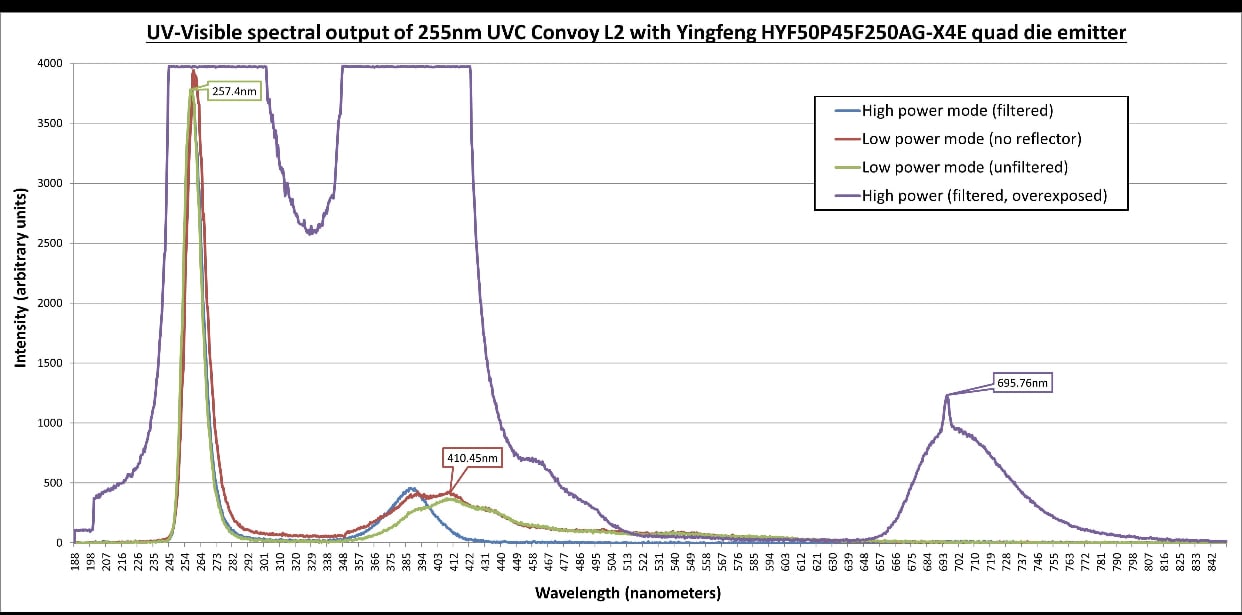
The first plot shows a single peak for all modes/filters, but the second plot shows the secondary peak at 395~405nm for the same emitter and modes. What’s going on here?
The second is a zoom showing the minor secondary emission spectra, so there’s light around 400 and 675. It also shows the filter attenuates the 400+ light but doesn’t help with the <400 light so much.

What is the difference between these two plots?
The first plot shows a single peak for all modes/filters, but the second plot shows the secondary peak at 395~405nm for the same emitter and modes. What’s going on here?
The second is a zoom showing the minor secondary emission spectra, so there’s light around 400 and 675. It also shows the filter attenuates the 400+ light but doesn’t help with the <400 light so much.