Various “studies” (of various qualities) about samplers in Stable Diffusion has been done over the yeas. By now, we should all understand the weaknesses of such studies, including the subjectivity of quality assessment and the randomness of generation (only amplified by the fact that they don’t all converge to the same image for the same seed!)
I felt it was time for an updated, large, well-controlled study:
https://docs.google.com/spreadsheets/d/1SOF9adj1CT9bX0x5h45J8p4PakbJXqFB0kPxAOm_3qw/edit?usp=sharing
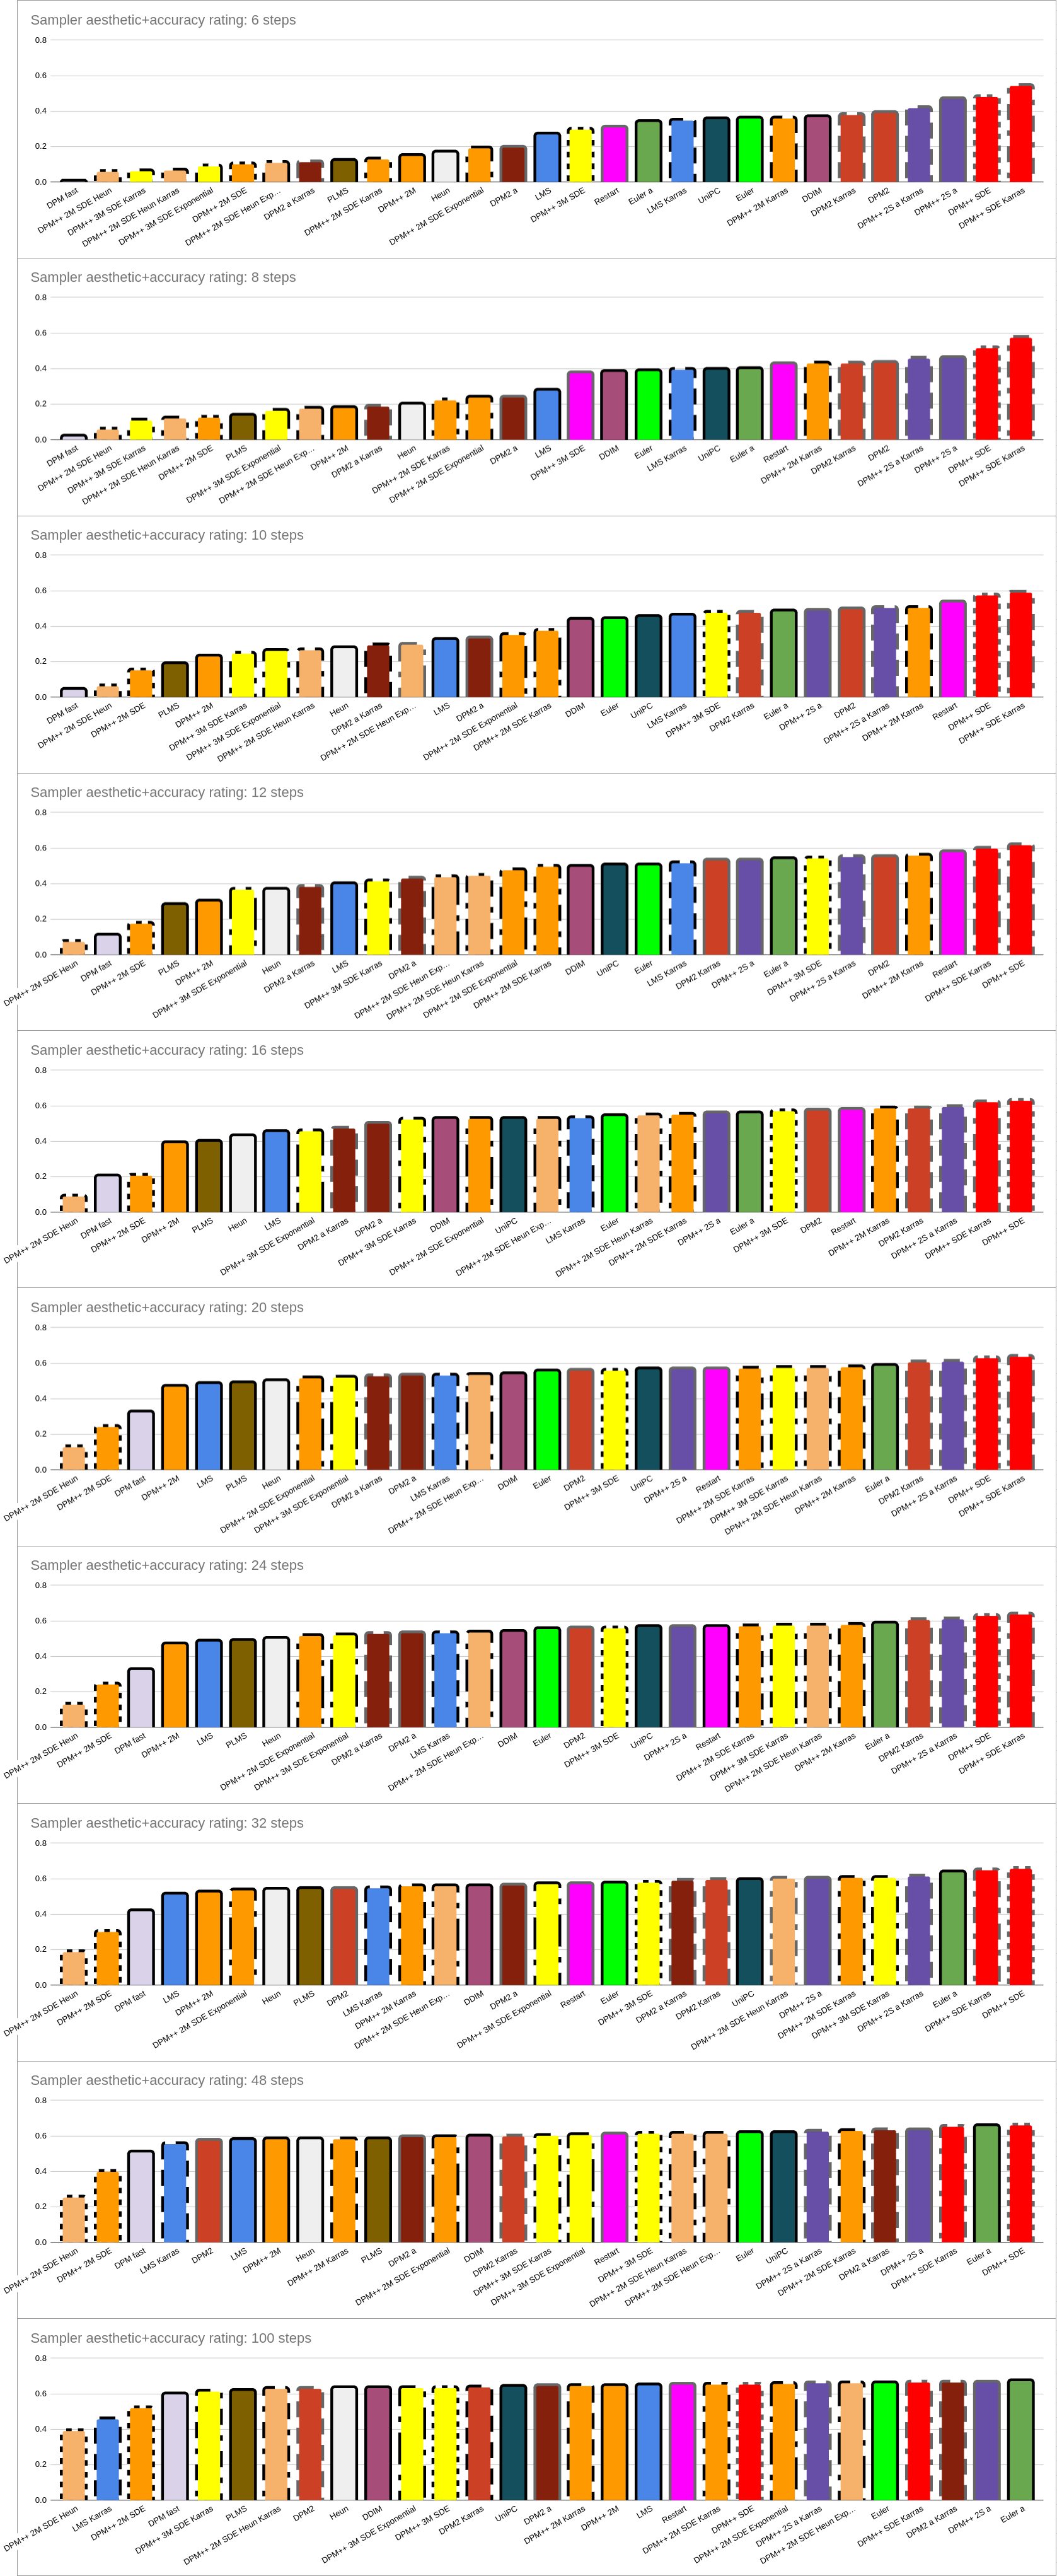
Twelve separate prompts were run on SDXL 1.0 (cfg_scale==7) at the following step counts: 6, 8, 10, 12, 16, 20, 24, 32, 48, 100, for every sampler except DPM Adaptive++ - a total of 3480 images rated. To further increase the weighted number of images and reduce random noise, ratings for a given prompt were partially smoothed by partially averaging with their neighboring number of steps.
++ - DPM Adaptive ignores the step count and runs to convergence, and thus cannot be rated at a fixed number of steps.
Also complicating factors is the fact that some samplers run at half the speed of others:
- DPM++ SDE
- DPM++ SDE Karras
- Heun
- DPM2
- DPM2 a
- DPM++ 2S a
- DPM++ 2S a Karras
- Restart
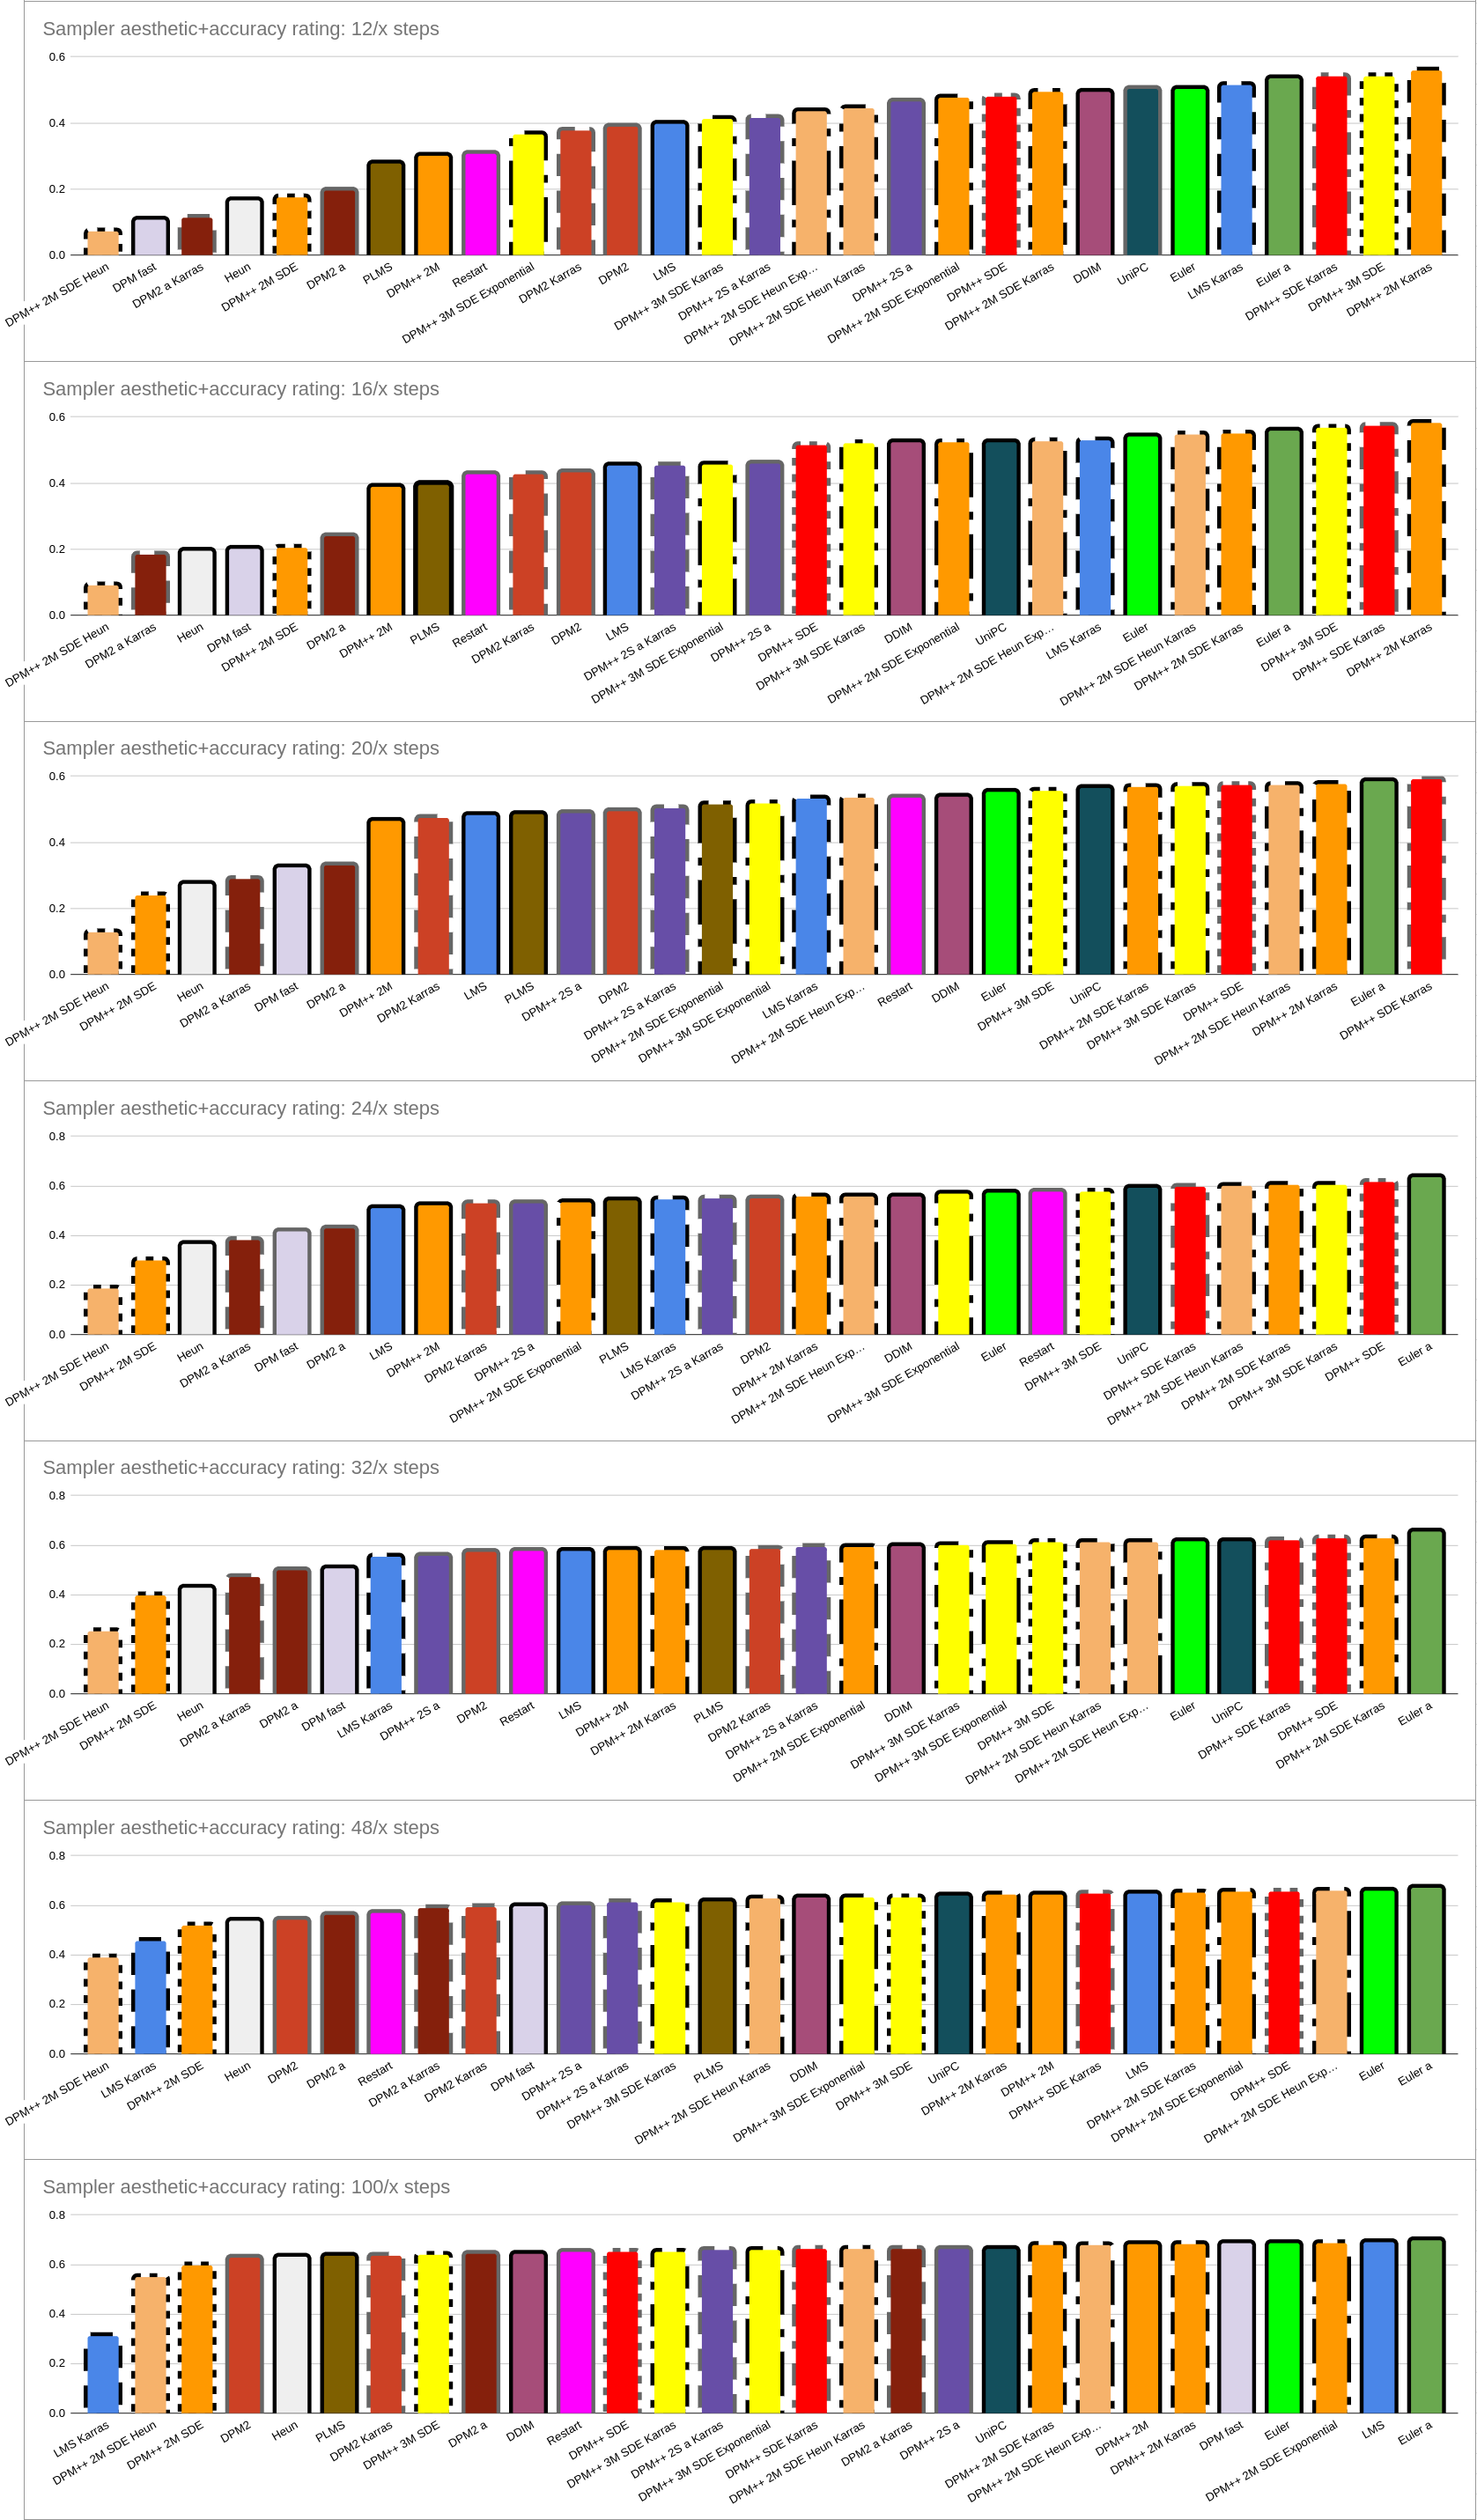
Hence, two sets of graphs were made: one set rating them purely by number of steps; and the other rating by the number of steps divided by their speed factor (e.g. the slower samplers are rated at half as many steps as the faster samplers).
Ratings are a subjective combination of two factors, on a scale of 0 to 1: accuracy (how accurately does it represent the prompt?) and aesthetics (how much would I be willing to have this on my wall, without further rework?). This allowed for the phenomenon where “not all poorly converged models are equal” - some poorly-converged models are generally ugly, while others can have weird but sometimes pretty abstract aspects to their poor convergence.
A word of caution: though a good number of images are used, there’s still going to be alot of noise in these ratings. In particular, at e.g. 48 and esp. 100 steps, most of the ordering you’re seeing in sampler quality (except for the lousy ones) is just going to be random noise. If two samplers have similar ratings, they should be considered as equivalent, even if one came out slightly better than the other.
On the graphs, a variety of colour and pattern codings are used, for visual convenience:
- Maroon: DPM2 group
- Red: DPM++ SDE group
- Orange: DPM++ 2M group
- Yellow: DPM++ 3M group
- Green: Euler group
- Blue: LMS group
- Purple (dark): DPM++ 2S group
- Purple(medium): DDIM
- Slate: DPM Fast
- Brown: PLMS
- Pink: Restart
- Navy: UniPC
- Light grey: Heun
- Light orange: DPM++ 2M Heun group
- Dark maroon: DPM2 a group
- Dark green: Euler a
- Black border: fast sampler
- Grey border: slow sampler
- Dotted border: SDE
- Dashed border: Karras
- Dot-dash border: SDE Karras
- Dot-longdash border: SDE Exponential
All of this get stated, let’s get started!
1) Steps-Only (Left-hand graphs)

- DPM++ SDE, and esp. DPM++ SDE Karras (red), rock this comparison. At high step counts there’s not much of a difference between the two, but at low step counts, DPM++ SDE Karras is much better. It’s so good that at 6 steps it gets results that most samplers don’t beat until around 20 steps.
If you care only about step counts, end this right here: chose DPM++ SDE Karras
-
DPM-based Karras samplers in general (dashed outlines) - with the exception of those samplers that are lousy in general) - perform very well at low steps, but the advantages are lost at higher steps.
-
Slow samplers (grey outlines) in general perform well - though this shouldn’t be surprising, as they’re doing more work per step.
-
Other contenders for good samplers are the DPM++ 2S group (esp. at lower step counts), DPM2 group (esp. at lower step counts), Restart (esp. at higher step counts), and to a lesser extent, DPM++ 2M Karras (esp. at higher step counts) and Euler group (at higher step counts - esp. ancestral).
-
Don’t even dream of touching DPM fast, DPM++2 2M SDE or DPM++ 2M SDE Heun. Also avoid: DPM++ 2M, LMS, PLMS, Heun. Exponential samplers aren’t great either. The only DPM++ 2M group samplers which should be considered are Karras and SDE Karras.
-
Again, at high step counts, don’t pay much attention to the order, as most samplers are fully converged, and you’re just viewing noise.
2) Accounting For Sampler Speed (Right-hand graphs)

There’s a little more complexity here
-
At low steps, DPM++ 2M Karras wins (and makes a strong showing throughout).
-
At high steps, Euler a wins (and Euler isn’t bad either). Like 2PM++ 2M Karras, Euler a also makes a strong showing throughout.
-
Despite being slow and thus only getting half as many steps, the SDE samplers still make an impressive showing in this comparison.
-
DPM+ 3M is very good at low steps but only pretty good at high steps.
-
DPM-based Karras samplers continue to offer a boost at low steps without hurting at high steps.
-
Don’t even think about DPM++ 2M SDE Heun. Also avoid: DPM++ 2M SDE, Heun, DPM2 group and DPM2 a group, PLMS, and honestly a lot of others aren’t great.
-
LMS Karras is pretty good at low steps but actually the worst at high steps, for some reason - it’s quality drops at high step counts.
-
As usual, don’t pay too much attention to the ordering at 100/x steps (or to a lesser extent, 48/x steps), as images tend to be well converged regardless of sampler.
-= Overall conclusions =-
- If you want an overall good sampler, regardless of metric
- If you only care about quality for a given number of steps, go with DPM++ SDE Karras
- If you care about speed for a given number of steps, and don’t want to break it down further, go with DPM++ 2M Karras or Euler a
- If you want to break it down further, go with DPM++ 2M Karras at low step counts and Euler a at high step counts.
-= Further work =-
If anyone wants to further help improve this with more data (thus reducing random noise), feel free to add to the aforementioned project link spreadsheet:
https://docs.google.com/spreadsheets/d/1SOF9adj1CT9bX0x5h45J8p4PakbJXqFB0kPxAOm_3qw/edit?usp=sharing
Pick a prompt, go to the next unused ratings block, write down the positive and negative prompts in column P (please, nothing NSFW, offensive, suggestive or objectifying), render all combinations of steps and samplers with that prompt (using SDXL 1.0, CFG scale=7, 1024x1024, no other plugins or features), and rate them all. Choose a different seed for each step count to avoid e.g. ancestrals getting a better or worse image than non-ancestrals getting boosted or penalized on every single step. Remember that you’re balancing out (A) how accurately the image corresponds to the prompt, and (B) how aesthetic it is, e.g. how keen would you be on hanging it in your living room?
All calculations will be redone automatically, and the ratings resorted. However, the colours and border styles on the graphs won’t move with any changing ratings - this has to be done manually, which takes some time. I find this easiest to do by copying column A into column D to change the labels into descriptions of their colour and border style, and then when I’m done, copying column B into column D to restore the names. In the colour descriptions, a colour name like 3darkgreen means “the third step from the bottom of the green column, moving upward” (“darkgreen” would mean the bottom, "2darkgreen the second, etc), while a colour name like “3lightmaroon” would mean “the third step from the lighest colour in the maroon column, moving downward”. Something just like “green” would mean the saturated primary colour at the top of the green column. If this is too much work or too confusing, just let me know when you’re entirely finished and I’ll update the graphs when I get a chance.
ED: Note based on a comment below: when I write “fully converged”, it probably would be better to write something like “has reached its full aesthetic potential”, since not all models literally converge.


All of the “a” samplers are ancestor samplers and will not converge on a final image. They will just keep on trying to “fix” the image with different variations. There’s kind of no point in testing them, especially since they almost always have non-ancestral counterparts that work more deterministically.
Also, why is DPM++ 3M not in the conclusions? It seems off to me that the latest version of DPM++ is somehow worse than DPM++ 2M. Also, Euler and DDIM, some of the oldest samplers ever, are rated quite high here, and that already has me questioning the results.
This was not a convergence test; it was an “accuracy + aesthetics” test.
There very much is a point to testing the accuracy and aesthetics of samplers, including ancestral ones. Indeed, that’s the entire point. By contrast, the whole point of doing a large number of tests is to compensate for the fact that you’re not going to get the same result with every sampler at every number of steps, and thus a large number of tests offsets the luck of the draw.
I have no sampler named just “DPM++ 3M”. I have three DPM++ 3M samplers: SDE, SDE Karras, and SDE Exponential - the yellow samplers in the graphs.
Anything can “feel off” to you, but this is what the data shows. I had some of my own biases coming into this that got busted in the process (while I wasn’t surprised by DPM++ SDE’s performance, I expected the new samplers to be standouts and old samplers like Euler a to be poor). If you feel the sample size is too small or is somehow biased, by all means contribute - I literally included the spreadsheet link so others could take part! :) Just a caveat: do your best to not mentally keep track of what sampler’s images you’re rating; we want it to be as “blind” of a test as can be reasonably done.