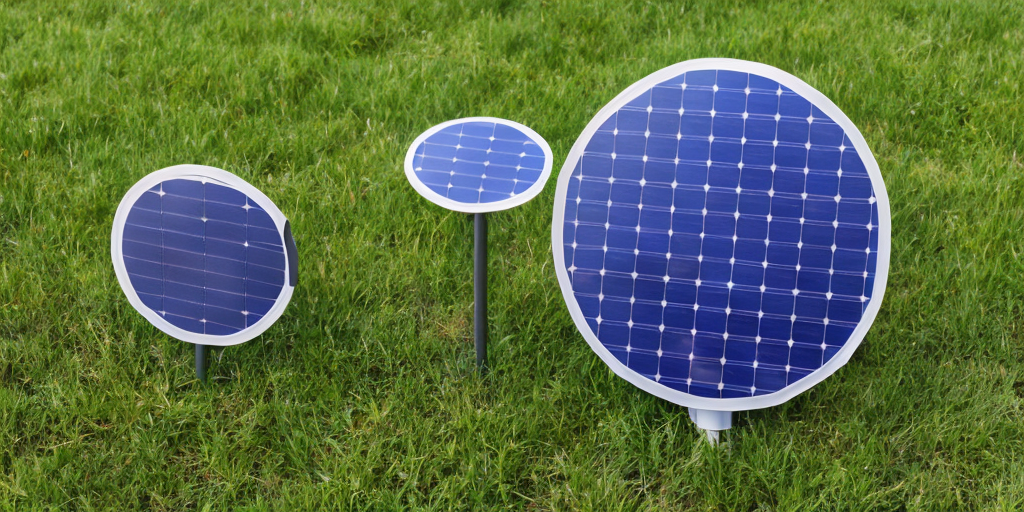
For several years I’ve used a Raspberry Pi Zero for sensors, camera & door motor control which opens & closes a chicken coop door. The Rpi & controller is 5v, the motor is 12v. This has been powered by around 50’ of extension cord, but the elements are beginning to weather the cord & we also need to move the chickens further away from our mains. I think it is time to implement solar. I aspire to assemble a PV, battery, & converter system which:
- Uses an off-the-shelf 12v PV panel (30w or so)
- Uses LiFePO cells for heat resiliency & stability
- Provides both 12v & 5v power
- Isn’t proprietary; uses standard, easily-sourced components… unless it meets specs perfectly & isn’t terribly expensive.
- Minimal power draw; at most 2 amps @ 12v for 10 seconds twice daily.
Does anyone have suggestions regarding this configuration, know of a post, blog, or video which does something similar, or is willing to ID components you’d recommend for this project?


You can model average insolation (and use that to extrapolate average harvest) by month using tools like PVwatts. Here’s a walkthrough.
Using Bowling Green, KY as an example since it’s on the 37th. 100w of flatmounted panel on an MPPT solar charge controller would average:
Solar wattage	100
Month	Daily Wh Avg
Jan	168
Feb	249
Mar	331
Apr	426
May	513
Jun	598
Jul	555
Aug	506
Sep	396
Oct	305
Nov	201
Dec	156
Average	367
Derate those yields by ~18% if using PWM. <– rule of thumb, not gospel
if we are on the west coast instead, here’s Santa Cruz, California:
Solar wattage 100 Month Daily Wh Avg Jan 206 Feb 286 Mar 386 Apr 519 May 582 Jun 642 Jul 605 Aug 542 Sep 447 Oct 349 Nov 245 Dec 183 Average 416The figures above are daily averages, including normal weather patterns and are how we size our systems. But for the sake of curiosity/understanding, my observations have been that if my clear-day harvest is X then overcast is 0.6X, bright overcast is 0.7X and dark/rainy is 0.05-0.10X. Cloud-edge effect and other reflective phenomena can result in harvest >1X.
A battery warming solution could be implemented for $20 (warming pads, 12v temp controller).
Not OP but this is really neat. Thanks.
Over the past few days my system has been severely under performing in relation to these calculations. For January it says 290 Wh per day, but I’m only seeing 50. I do have a lot of trees, so probably some shading… maybe even a lot of shading.
Jan	290.3
Feb	392.9
Mar	387.1
Apr	400.0
May	387.1
Jun	400.0
Jul	419.4
Aug	387.1
Sep	400.0
Oct	322.6
Nov	300.0
Dec	290.3