

I’ve started encountering a problem that I should use some assistance troubleshooting. I’ve got a Proxmox system that hosts, primarily, my Opnsense router. I’ve had this specific setup for about a year.
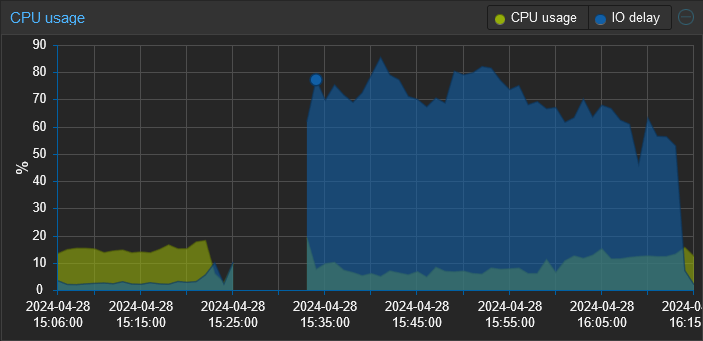
Recently, I’ve been experiencing sluggishness and noticed that the IO wait is through the roof. Rebooting the Opnsense VM, which normally only takes a few minutes is now taking upwards of 15-20. The entire time my IO wait sits between 50-80%.
The system has 1 disk in it that is formatted ZFS. I’ve checked dmesg, and the syslog for indications of disk errors (this feels like a failing disk) and found none. I also checked the smart statistics and they all “PASSED”.
Any pointers would be appreciated.
Edit: I believe I’ve found the root cause of the change in performance and it was a bit of shooting myself in the foot. I’ve been experimenting with different tools for log collection and the most recent one is a SIEM tool called Wazuh. I didn’t realize that upon reboot it runs an integrity check that generates a ton of disk I/O. So when I rebooted this proxmox server, that integrity check was running on proxmox, my pihole, and (I think) opnsense concurrently. All against a single consumer grade HDD.
Thanks to everyone who responded. I really appreciate all the performance tuning guidance. I’ve also made the following changes:
- Added a 2nd drive (I have several of these lying around, don’t ask) converting the zfs pool into a mirror. This gives me both redundancy and should improve read performance.
- Configured a 2nd storage target on the same zpool with compression enabled and a 64k block size in proxmox. I then migrated the 2 VMs to that storage.
- Since I’m collecting logs in Wazuh I set Opnsense to use ram disks for /tmp and /var/log.
Rebooted Opensense and it was back up in 1:42 min.
You are very welcome :)