

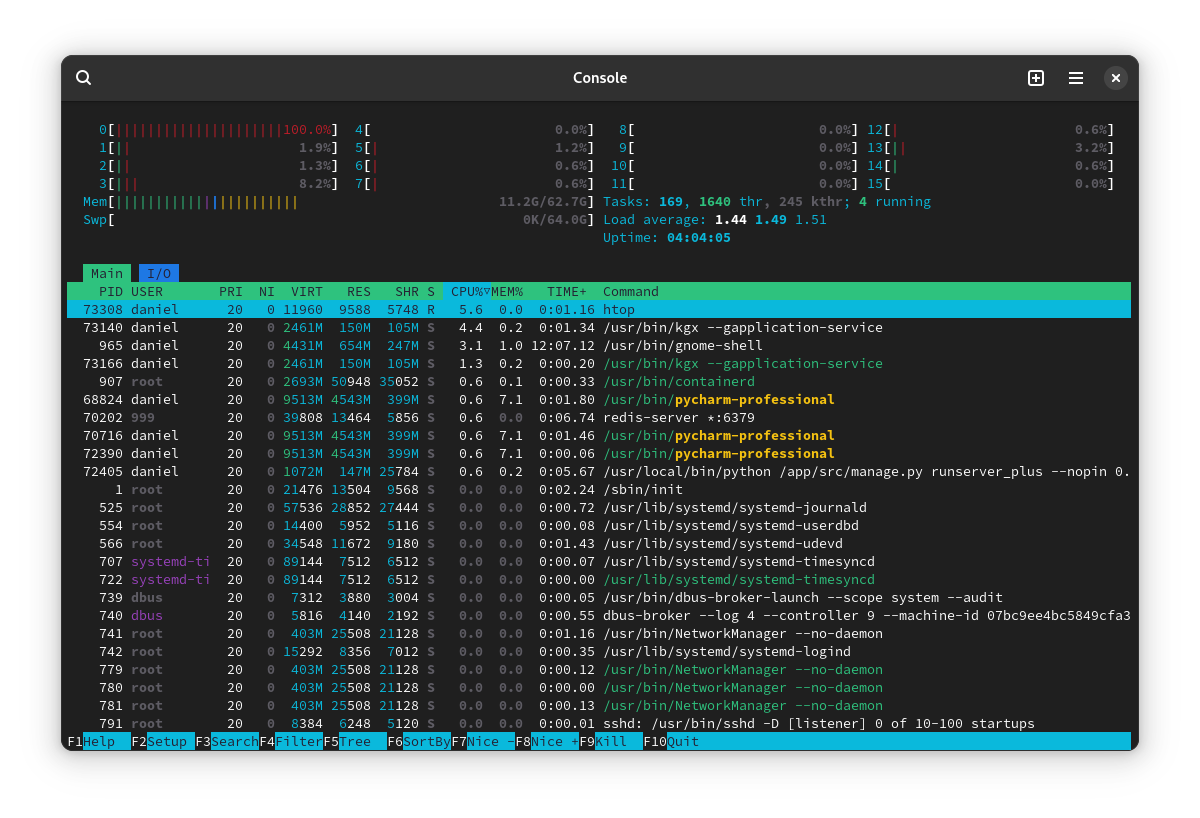
From time to time, often after I’ve restored from sleep or finished playing a Steam game, one of my CPU cores is pinned at 100% with no indication of what might be doing it. Running htop, btop, or GNOME system monitor all show the same thing: CPU0 at 100% while the rest are doing near-nothing, and no process in particular seems to be using those resources.
If I restart, it’s back to normal, and sometimes I can play a game in Steam or let the computer go to sleep and it doesn’t do this, but it happens often enough that’s annoying/confusing so I’d like to know if there’s a way to either (a) diagnose which processes are using which CPU cores, or (b) somehow “reset” the checking of these values to make sure that something’s not just being misreported.
This is a desktop system running Arch & GNOME.
You must log in or register to comment.
I blame Daniel
It’s the Linux version of steam taking advantage of idle time to process shaders. It’s a critical part of making all those proton launched games working right. I wish it had better control for when to run it but it is what it is.
This isn’t the case here and you can turn the background processing off or change how many cores it’ll use.
Why does it only use one core?
Show kernel threads, it’s a setting in the htop config menu that is off by default.
There it is! Thank you! It’s a process owned by root called
kworker/0:0+kacpid. Any idea what that is?[Edit 1] Interestingly, I can’t even
kill -9it.[Edit 2] With
kworker kacpidto work with, I did a quick search and found this SO page that has some interesting information that I only partially understand, but the following worked like a charm:# grep -Ev "^[ ]*0" /sys/firmware/acpi/interrupts/gpe?? | sort --field-separator=: --key=2 --numeric --reverse | head -1 /sys/firmware/acpi/interrupts/gpe09:11131050 STS enabled unmasked # echo disable > /sys/firmware/acpi/interrupts/gpe09It’s not clear to me what an interrupt is or whether this
gpe09value is meant to be persistent across reboots, or why this only seems to be happening in the last couple months, but if I can make it go away by running the above from time to time, I guess it’s alright?An interrupt is an input that can be triggered to interrupt normal execution. It is used for e. g. hardware devices to signal the processor something has happened that requires timely processing, so that real-time behavior can be achieved (for variable definitions of real-time). Interrupts can also be triggered by software, and this explanation is a gross oversimplification, but that information is what is most likely relevant and interesting for your case at this point.
The commands you posted will sort the interrupts and output the one with the highest count (via head -1), thereby determining the interrupt that gets triggered the most. It will then disable that interrupt via the user-space interface to the ACPI interrupts.
One of the goals of ACPI is to provide a kind of general hardware abstraction without knowing the particular details about each and every hardware device. This is facilitated by offering (among other things), general purpose events - GPEs. One of these GPEs is being triggered a lot, and the processing of that interrupt is what causes your CPU spikes.
The changes you made will not persist after a reboot.
Since this is handled by kworker, you could try and investigate further via the workqueue tools: https://github.com/torvalds/linux/tree/master/tools/workqueue
In general, Linux will detect if excessive GPEs are generated (look for the term “GPE storm” in your kernel log) and stop handling the interrupts by switching to polling. If that happens, or if the interrupts are manually disabled, the system might not react to certain events in a timely manner. What that means for each particular case depends on what the interrupts are being responsible for - hard to tell without additional details.
That’s a kernel worker for ACPI. It sounds like you may have a driver for something that is misbehaving.
You can’t kill that because it’s a kernel thread. They are not like normal process; these objects are part of the operating system and terminating such a thread can cause in stability.
To me it sounds like your root cause is either a driver problem or your hardware is misbehaving a little bit in a way the driver doesn’t expect, firing a lot of interrupts that shouldn’t normally happen.
If this seems to resolve your issue, I wouldn’t lose any sleep over it. I would think my hardware is a little bit weird or there’s a bug somewhere in the driver for it. You can also try different kernel versions if your distribution gives you the option, because kernels come with different versions of drivers.
I’ve had this happen with AI stuff that runs in a Python venv. It only happens with apps that use multi threading, and usually when something is interrupted in an unintended or unaccounted for way. I usually see it when I start screwing with code stuff, but also from changing the softmax settings during generation or crashing other stuff while hacking around. There may be a bug of some kind, but I think it likely has more to do with killing the root threading process and leaving an abandoned child that doesn’t get handled by the kernel process scheduler in the standard way. If this happens I restart too.

