I recently got solar installed at my place and was wondering if anyone had tips on things like:
- Using the Energy dashboard effectively
- Template Sensors I should set up for energy tracking
- Graphs or visualising production/usage in dashboards
- Automations that you’ve used to help save using energy from the grid
Look up your inverter brand and pray there is an integration for it. Also: try to make your electrical meter smart to be able to tell the difference between pulling from grid and delivering to grid. If you already have a smart meter, see if it exposes some interface (like P1 with the DSMR protocol for example) to easily integrate the meter into home assistant.
I have done all this with a goodwe inverter and a kamstrup meter P1 port using a DSMR dongle.
If you need any pointers, dm me.
Mine has an integration which is handy (enphase). But it doesn’t tell me my grid usage. I’m trying to calculate it by taking my total consumption and subtracting my solar production. I think it roughly gives me the right overall number.
The problem is I can’t seem to get how much I’m feeding back into the grid. I might be able to work it out with some sort of calculation.
I might DM you about the P1, as it sounds like that might do the job.
For reference: smart meters like Kamstrup are in use all over the EU. Example of a p1 dongle is the “smart meter gateway” which can be read from home assistant via the DSMR integration or directly from mqtt.
This would give you the counters for exactly how much you have pulled from and pushed into the grid.
Can confirm this will integrate nicely into the energy dashboard.
And biggest tip: when you have configured everything, it will take up to 2 hours before any data is visible from the energy dashboard. This screwed me over quite a bit, needless to say :-)
I have enphase inverters as well. I don’t find their data to be useful.
I went the route of installing two circuit setup boards running esp8266. One is installed in the subpanel in the garage where the solar feeds, the other is installed at the main panel on the main cables before any loads.
This way I can more accurately see production and usage. And can tell during production how much I’m actually utilizing before sending residual back to grid.
If I had only one panel and the solar fed directly into it, I’d use one of the 6 channel circuitsetup boards instead to monitor both solar feed and main.
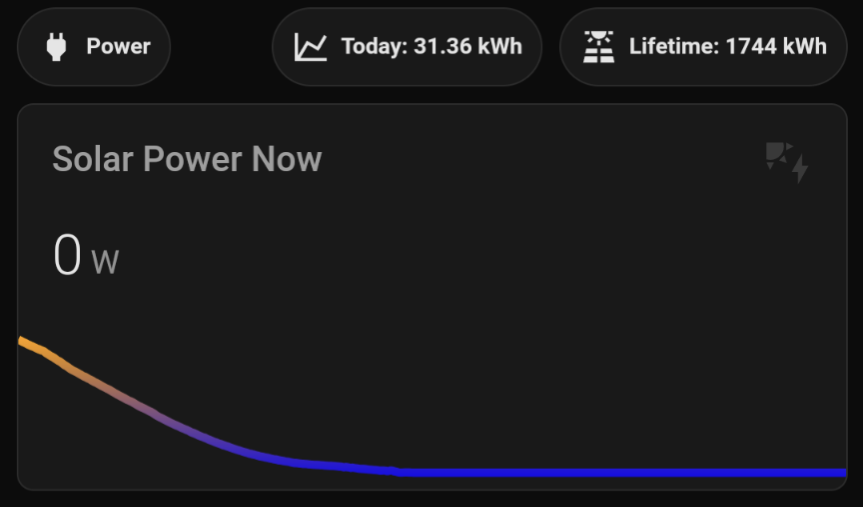
I like knowing my daily production and keeping that on my mushroom dashboard. That’s not an ootb metric on my SolarEdge system, but lifetime energy is. So I have an automation that records the total each night into a helper, and a Mushroom Template Chip card that does the math for me. It’s simple but it does the job.
type: template content: >- Today: {(states(‘sensor.solaredge_ac_energy_kwh’)} kWh icon: mdi:chart-line

Nice one. My system has that with its integration which is good. I’m yet to put it into a graph. The part missing from mine is working out how much I’m using from the grid.
I’ve been enjoying the power-flow-card-plus and energy-flow-card-plus visualizations. I’ve also set up a custom Grafana graph (HA -> InfluxDB -> Grafana).
I’m following this description of how to get my data from the HTTP API on my Enphase Envoy unit.
Thanks heaps for that. At the moment I’m relying on my Enlighten app login. Will check them out.
I had more success with using my energy monitor sensors than my inverter ones. My inverter (SolarEdge) seemed to have a fairly low refresh rate, and there’s also no information on power use.
I have a Sense energy monitor that has real time measurements and instead use that for my dashboard production and usage graph.
My solar is going up next week, so I’ve been experimenting a bit with working it into my current setup. I have import and export data from my smart meter, hourly electricity price from entso-e and a simulated solar production based on the lux reading from my outdoor pir sensors. To get real time production I specced an elko smart tag energy meter on the fuse for the inverter, as the solis is not easy for an amateur to get data out of. I also have smart relay on my water heater, and have been controlling this based on electricity price for a while now. I’m also working on adding the heat pump and bathroom heat, they will be set a couple of degreees lower when power is most expensive, and a couple higher when solar is produsing to “store” heat. Not sure how all this will work out yet so I’ll not share the details before I’m sure it works, but I hope it gives som ideas.
For visualizations I use apexcharts, i can fit solar production, consumption and price with and without grid tariff in a single card, althought it’s not quite perfekt yet.


