@[email protected]M to Science [email protected]English • 3 months agoWhat the fuckmander.xyzimagemessage-square38fedilinkarrow-up1247arrow-down134
arrow-up1213arrow-down1imageWhat the fuckmander.xyz@[email protected]M to Science [email protected]English • 3 months agomessage-square38fedilink
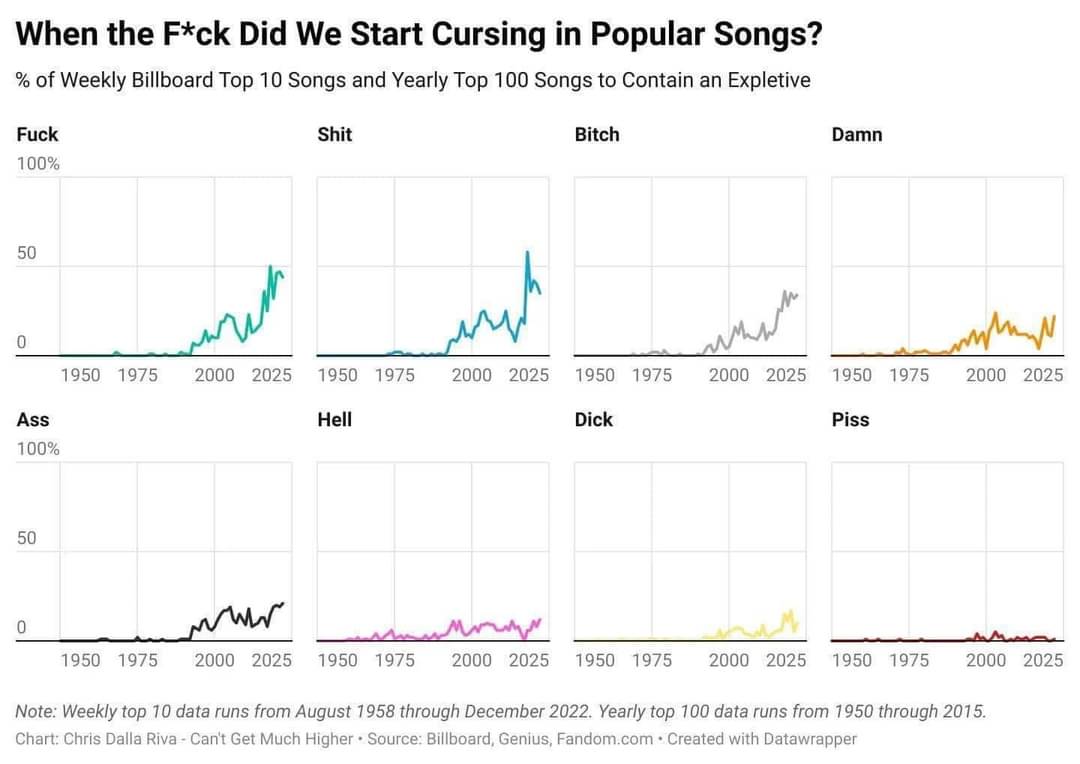
minus-square@[email protected]linkfedilinkEnglish53•3 months agoSo some time between 1975 and 2000. If only the graphs had some labels near the relevant part of the data…
minus-square@[email protected]cakelinkfedilinkEnglish2•edit-23 months agoLooks to be around the beginning of the 90s or late 80s.


So some time between 1975 and 2000. If only the graphs had some labels near the relevant part of the data…
Looks to be around the beginning of the 90s or late 80s.