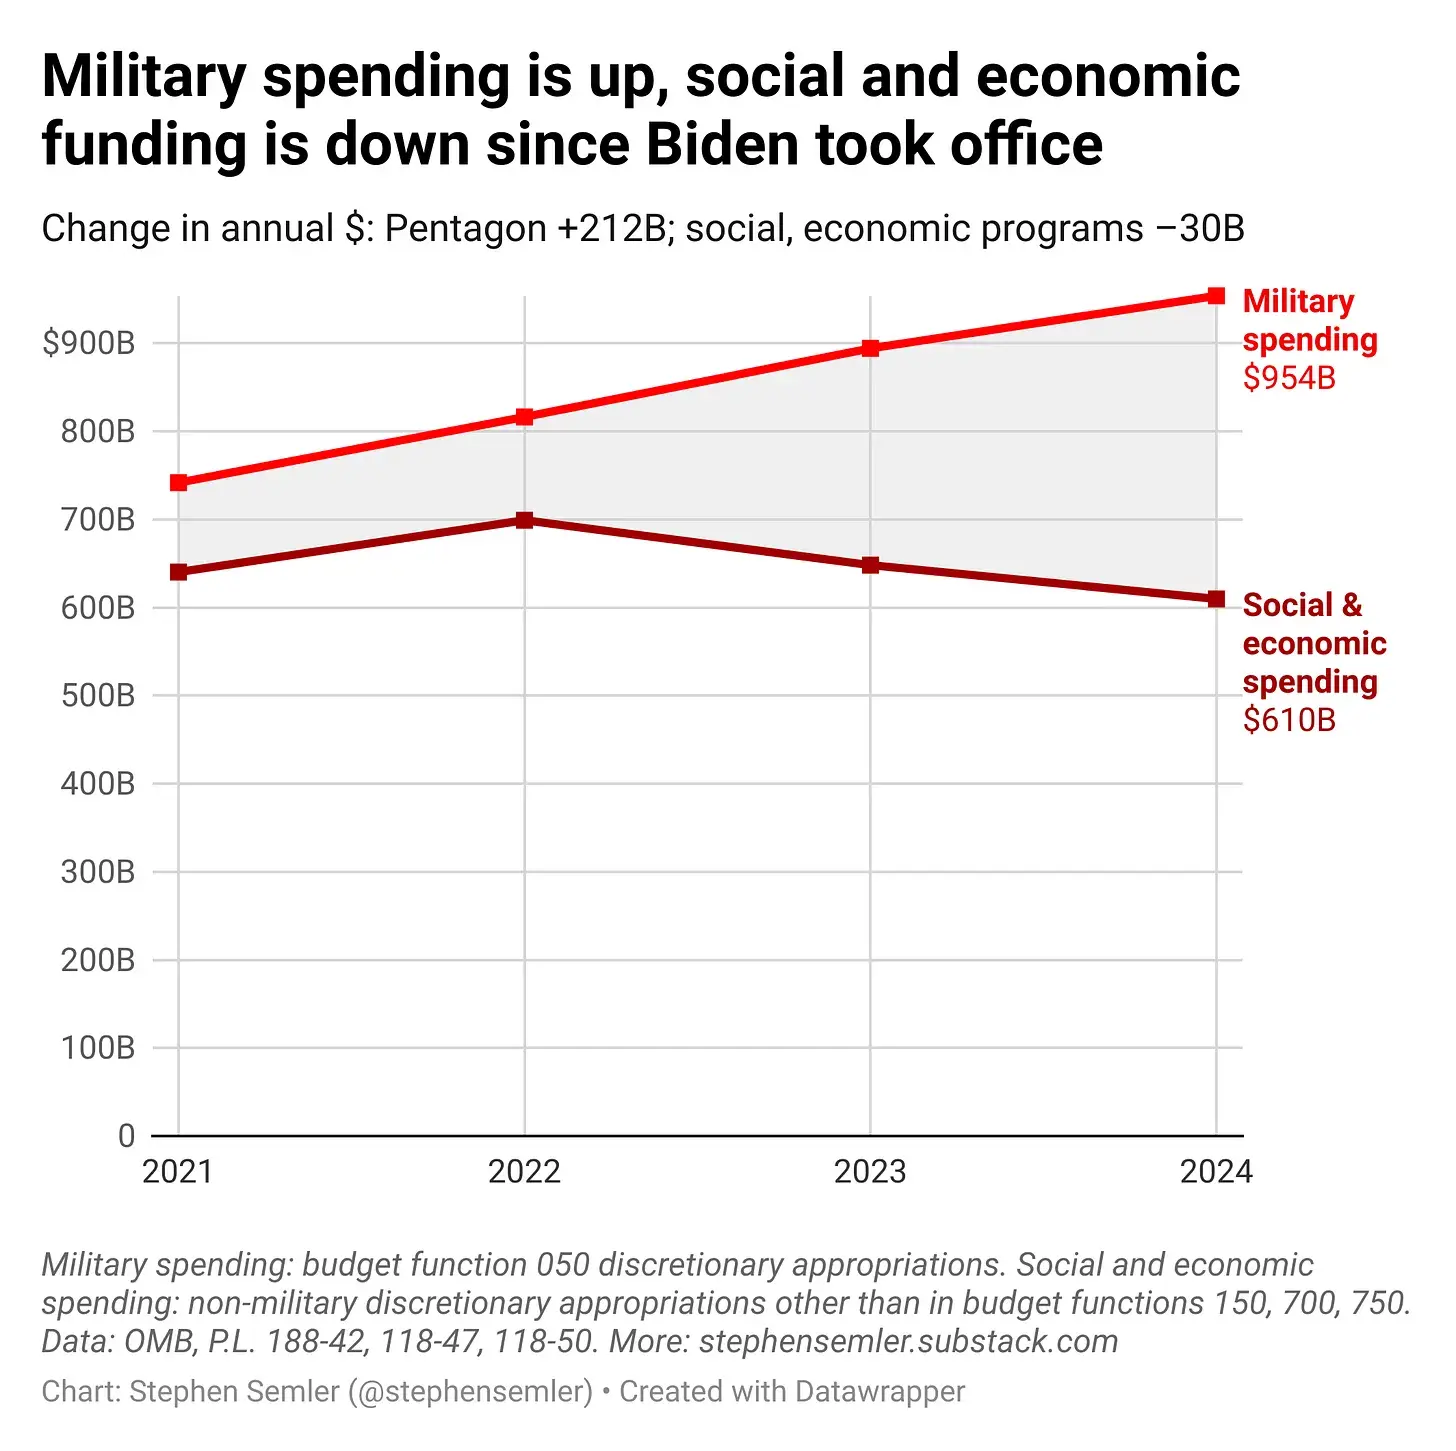
Because of some of the COVID social programs, that chart should go back another 5 years, or so, to show a more accurate picture of the trend. I have no idea what it would look like, but my first thought is that 2022 is when the remaining COVID protections started being phased out which would, obviously, reduce the spending number. So, going back to 2019 and even 2018 would give us a better idea of the relative spend now versus then.


Because of some of the COVID social programs, that chart should go back another 5 years, or so, to show a more accurate picture of the trend. I have no idea what it would look like, but my first thought is that 2022 is when the remaining COVID protections started being phased out which would, obviously, reduce the spending number. So, going back to 2019 and even 2018 would give us a better idea of the relative spend now versus then.