I tend to use a couple of different Polling conglomerate sites to get my info. All reputable, all easy to read, but all slightly different (538 trends slightly left, RealClear trends slightly right, and The Hill is relatively centrist).
I feel more comfortable in this because none of the 3 are disagreeing on basic trends or rough ranges. They all showed the same pattern since the start of the month of Kamala Harris slowly gaining ground, just the baseline and the exact pace of the change is different(538 had her ahead by Late July, THQ had her ahead by August 3rd, and RCP had her ahead by August 5th). Sure, 538 has a stronger democrat baseline, RCP a stronger Republican baseline, they disagree on which polls to include sometimes, but the general trend line is in 100% agreement. The democrats have been gaining strength since the start of the month.
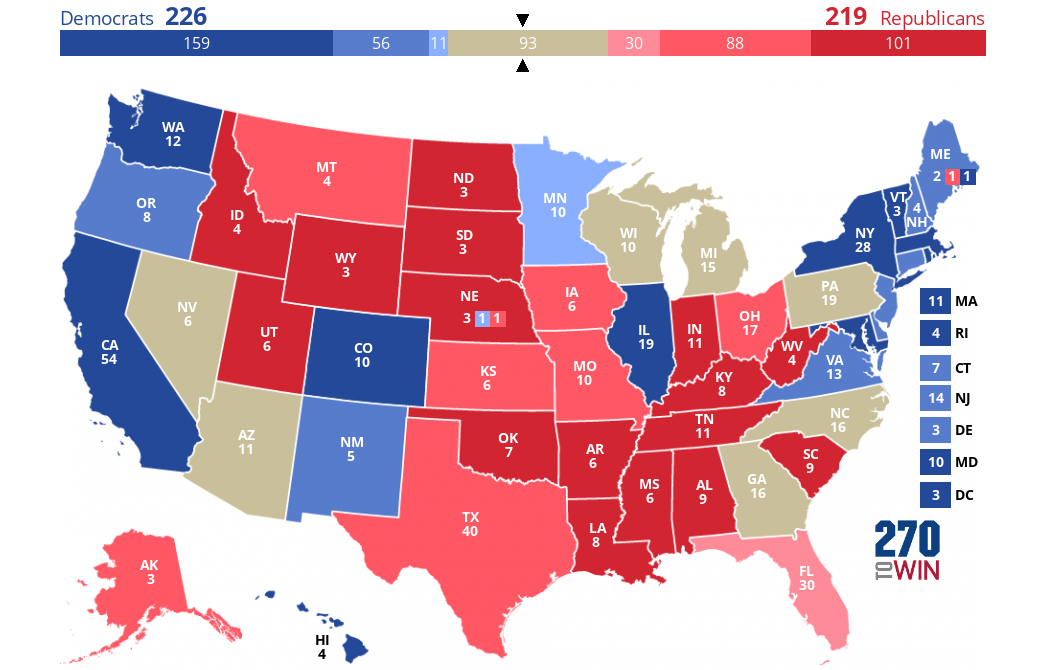
You can also use this on the State by State level, though it’s less accurate as there’s less info, especially for less tight Swingstates like NC or MI. In general Georgia is tightening, but none of the 3 sites have it ever going into the blue. 538 is dead even last two days, 0.1 Trump today, RCP is 0.8 for Trump, and The Hill is…2 points up, but they haven’t updated Georgia in a day or two so probably actually under 1. All 3 agree on a blue trend line, and in this case all 3 agree Trump is still the favorite, but how tight it is varies. That’s a normal polling difference.
Pennsylvania, same thing. All agree on a blue trend, 538 says Harris took the lead a bit ago, The Hill shows her just barely having done it, RCP still shows Trump half a point up. Same trend, no massive outlier variance, just different final numbers due to differences in weighing and which polls get included.
Reverse trend in other states, Nevada and Arizona are red on THQ and RCP, but just barely blue on 538. Definitely redder than Pennsylvania and also Nevada especially is horrifically underpolled, all 3 are using scraps. There’s universal agreement on North Carolina and Georgia(barely) being red and Michigan and Wisconsin being blue. None of the 3 sites show those going the other way albeit the ratio varries. Pennsylvania leans blue, Arizona leans red, Nevada leans on no fucking data what did the polling guys pull a Fear and Loathing and run off? It’s supposed to be Loathing on the Campaign Trail not in Vegas, god we need to double check the books we give these guys before we send them into Bat country.


I tend to use a couple of different Polling conglomerate sites to get my info. All reputable, all easy to read, but all slightly different (538 trends slightly left, RealClear trends slightly right, and The Hill is relatively centrist). I feel more comfortable in this because none of the 3 are disagreeing on basic trends or rough ranges. They all showed the same pattern since the start of the month of Kamala Harris slowly gaining ground, just the baseline and the exact pace of the change is different(538 had her ahead by Late July, THQ had her ahead by August 3rd, and RCP had her ahead by August 5th). Sure, 538 has a stronger democrat baseline, RCP a stronger Republican baseline, they disagree on which polls to include sometimes, but the general trend line is in 100% agreement. The democrats have been gaining strength since the start of the month.
You can also use this on the State by State level, though it’s less accurate as there’s less info, especially for less tight Swingstates like NC or MI. In general Georgia is tightening, but none of the 3 sites have it ever going into the blue. 538 is dead even last two days, 0.1 Trump today, RCP is 0.8 for Trump, and The Hill is…2 points up, but they haven’t updated Georgia in a day or two so probably actually under 1. All 3 agree on a blue trend line, and in this case all 3 agree Trump is still the favorite, but how tight it is varies. That’s a normal polling difference.
Pennsylvania, same thing. All agree on a blue trend, 538 says Harris took the lead a bit ago, The Hill shows her just barely having done it, RCP still shows Trump half a point up. Same trend, no massive outlier variance, just different final numbers due to differences in weighing and which polls get included.
Reverse trend in other states, Nevada and Arizona are red on THQ and RCP, but just barely blue on 538. Definitely redder than Pennsylvania and also Nevada especially is horrifically underpolled, all 3 are using scraps. There’s universal agreement on North Carolina and Georgia(barely) being red and Michigan and Wisconsin being blue. None of the 3 sites show those going the other way albeit the ratio varries. Pennsylvania leans blue, Arizona leans red, Nevada leans on no fucking data what did the polling guys pull a Fear and Loathing and run off? It’s supposed to be Loathing on the Campaign Trail not in Vegas, god we need to double check the books we give these guys before we send them into Bat country.