Blaze (he/him) to [email protected]English • 6 months agoLord of the Rings Characters: Screen Time vs. Mentions in the Booksfiles.catbox.moeimagemessage-square41fedilinkarrow-up1253arrow-down19file-text
arrow-up1244arrow-down1imageLord of the Rings Characters: Screen Time vs. Mentions in the Booksfiles.catbox.moeBlaze (he/him) to [email protected]English • 6 months agomessage-square41fedilinkfile-text
Source: https://old.reddit.com/r/dataisbeautiful/comments/1f7b5zp/lord_of_the_rings_characters_screen_time_vs/
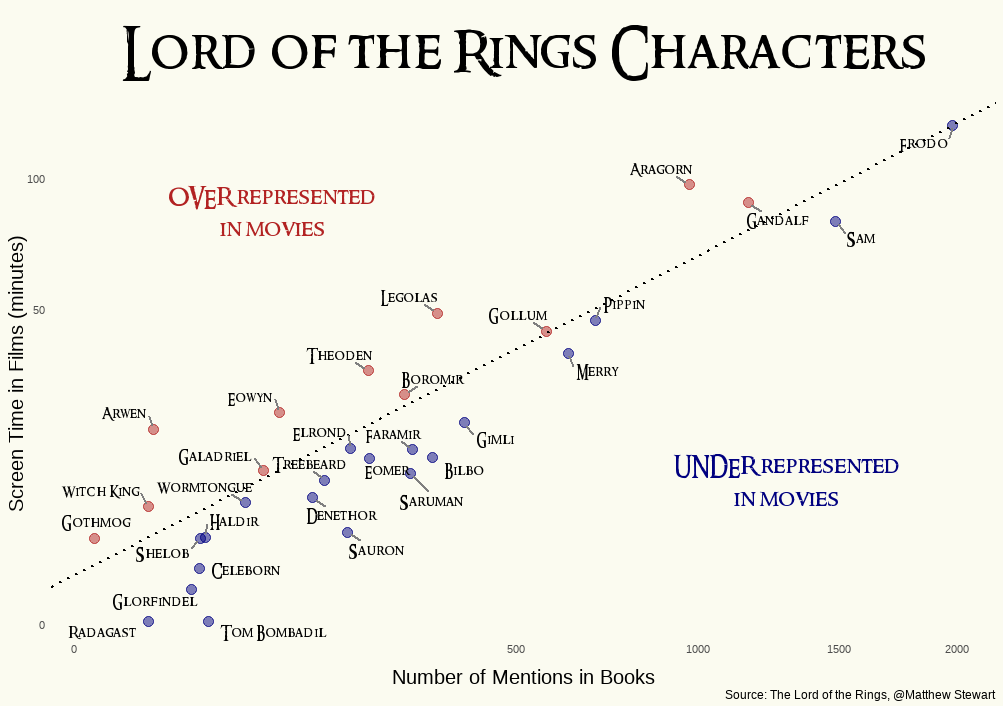
minus-square@[email protected]linkfedilinkEnglish13•5 months agoThe scale is neither linear nor logarithmic. What?
minus-square@bramkaandorplinkEnglish3•5 months agoHow else can you make it look like a linear grouping?
minus-square@[email protected]linkfedilinkEnglish3•5 months ago make it look like Data processing isn’t about making it look like something unless you are purposefully manipulating it.
minus-square@bramkaandorplinkEnglish1•5 months agoBut that’s what happened here. The x-axis has been unevenly distributed.
minus-square@[email protected]linkfedilinkEnglish0•5 months agoBecause the point isn’t to compare 2 characters, but to see how one character performs in the books and in the movies. And for that, it doesn’t matter. But they could have used a bar graph instead.
minus-square@[email protected]linkfedilinkEnglish1•5 months agoWell, I’d like to know if Arwen’s screentime/mention ratio is 2x or 3x that of the Frodo baseline. This arbitrary scale makes it impossible. It would not hurt to add more values to the axes, and perhaps a faint grid.


The scale is neither linear nor logarithmic. What?
How else can you make it look like a linear grouping?
Data processing isn’t about making it look like something unless you are purposefully manipulating it.
But that’s what happened here. The x-axis has been unevenly distributed.
Because the point isn’t to compare 2 characters, but to see how one character performs in the books and in the movies.
And for that, it doesn’t matter. But they could have used a bar graph instead.
Well, I’d like to know if Arwen’s screentime/mention ratio is 2x or 3x that of the Frodo baseline. This arbitrary scale makes it impossible. It would not hurt to add more values to the axes, and perhaps a faint grid.