Warning there are some tall-ass images in this post.
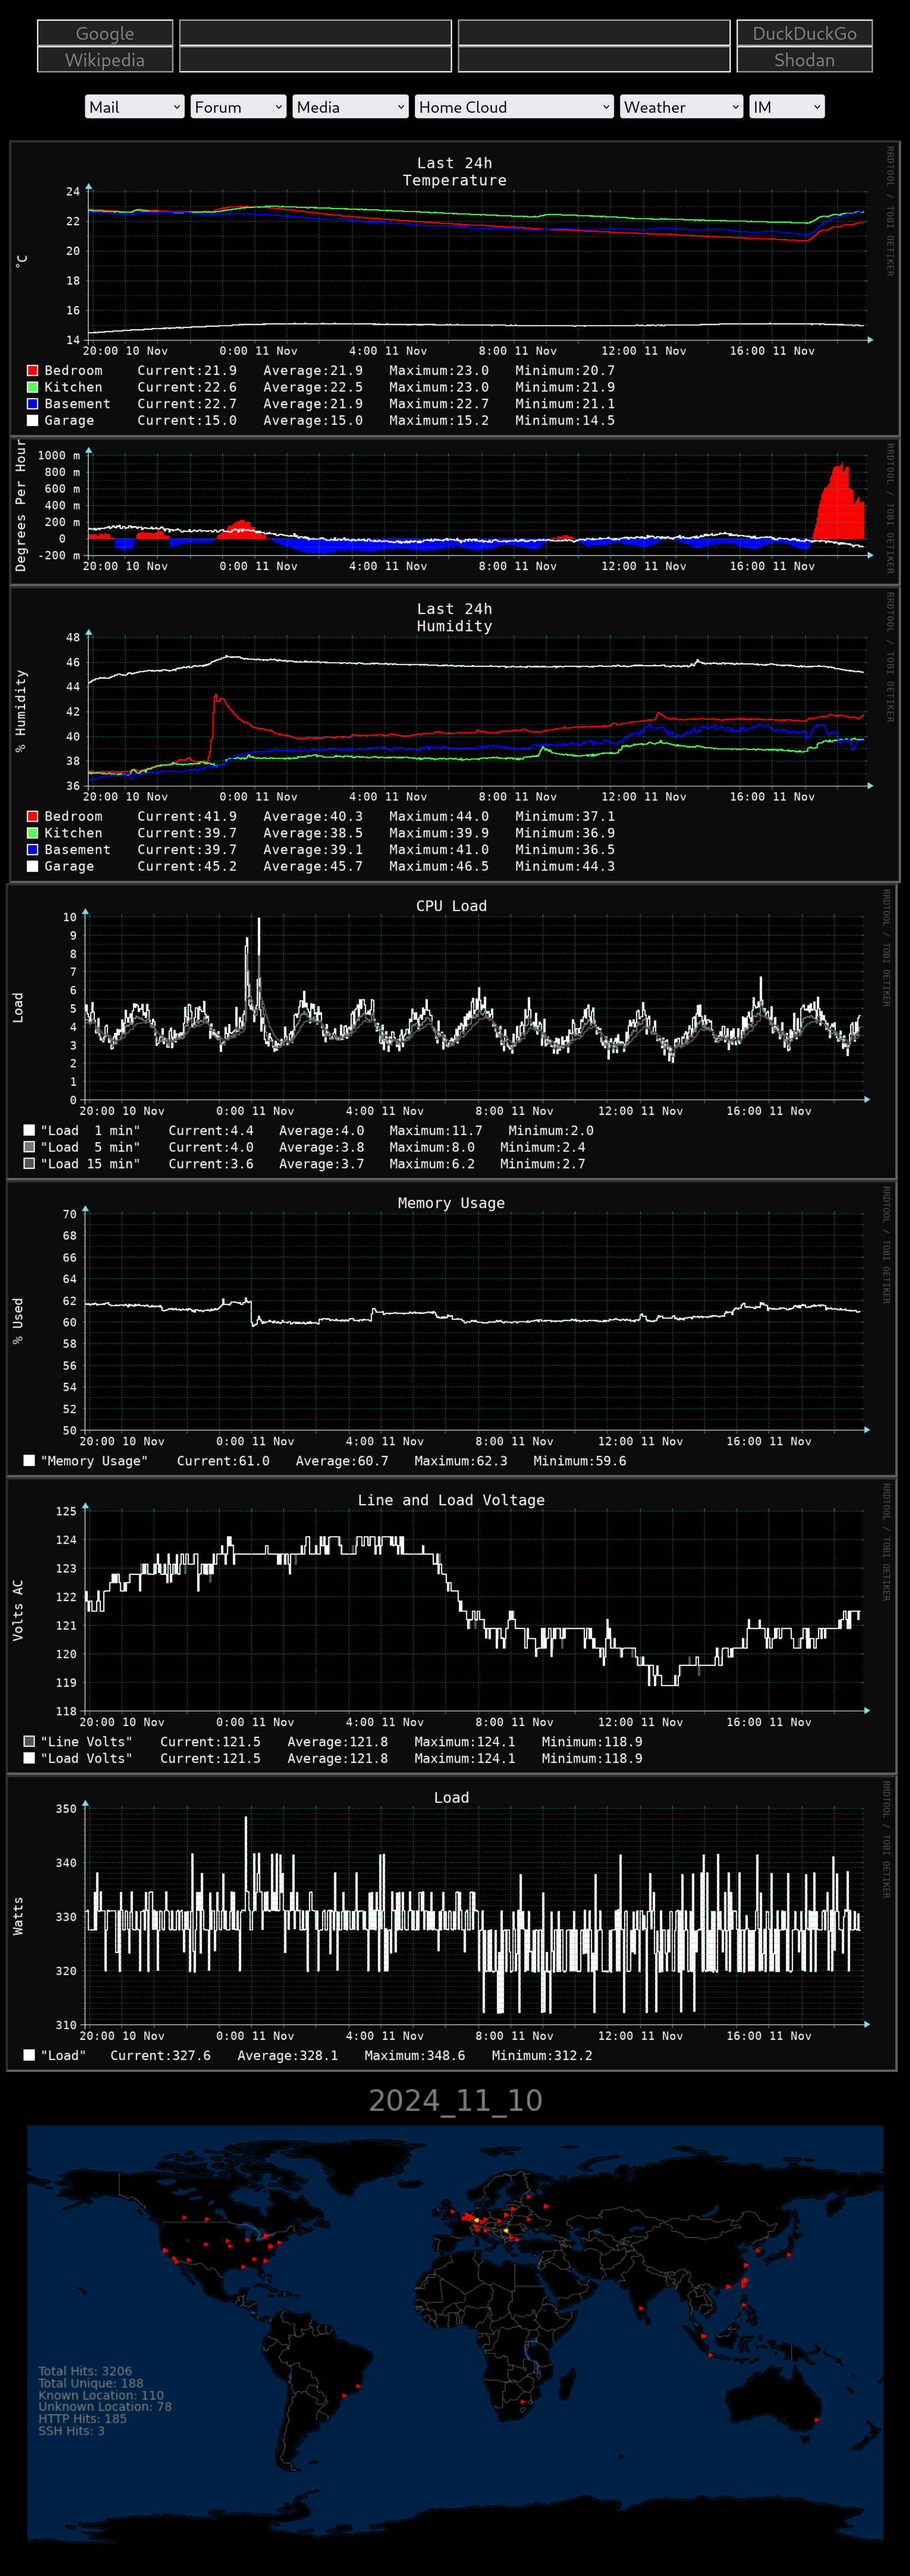
A few years ago I got mad enough at the temperature gradient in my town house that I designed and build a bunch of ESP8266 sensors to feed data into an RRD so that I could have some pretty graphs to be angry about as well. (As of this week I have also started logging stats from my UPS and server.) Using the minimum of HTML and CSS I threw those graphs, a map of the previous day’s incoming network traffic, and some convenient links onto a homepage that I use on all of my devices. At a glance this tells me if the furnace/AC is working, if my server is having a fit for unknown reasons, and if the local power grid is playing it fast and loose with the voltage and frequency (which I suspect they do).

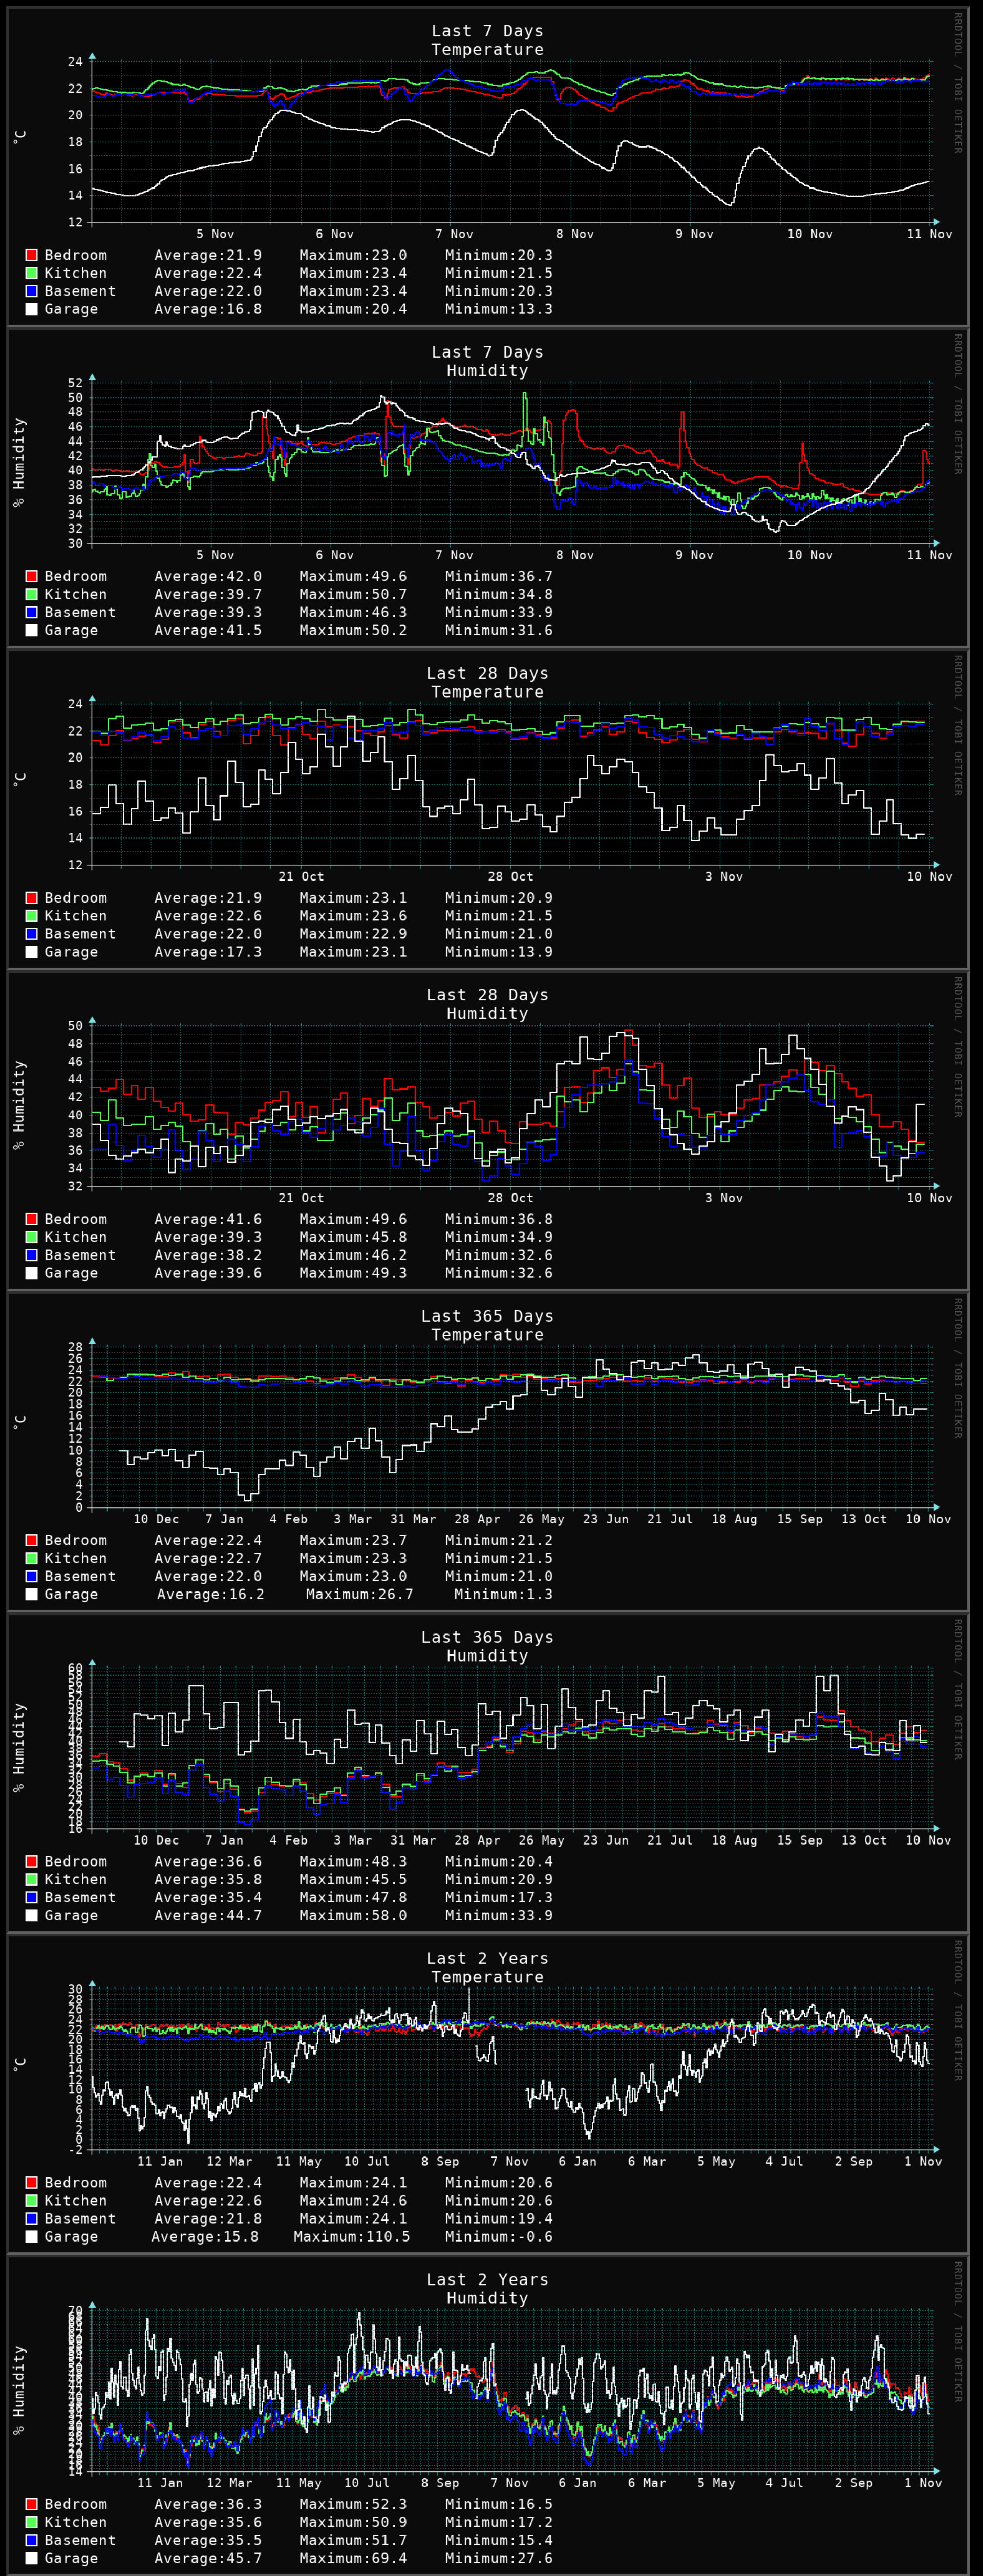
Clicking the temperature/humidity data leads to a long term data page covering 2 years of data in varying resolution. The gap last fall was when the garage sensor failed and I was waiting for Aliexpress.

There are also long term trends for the server load and UPS but they have only been logging for a few days so there is not much to look at.
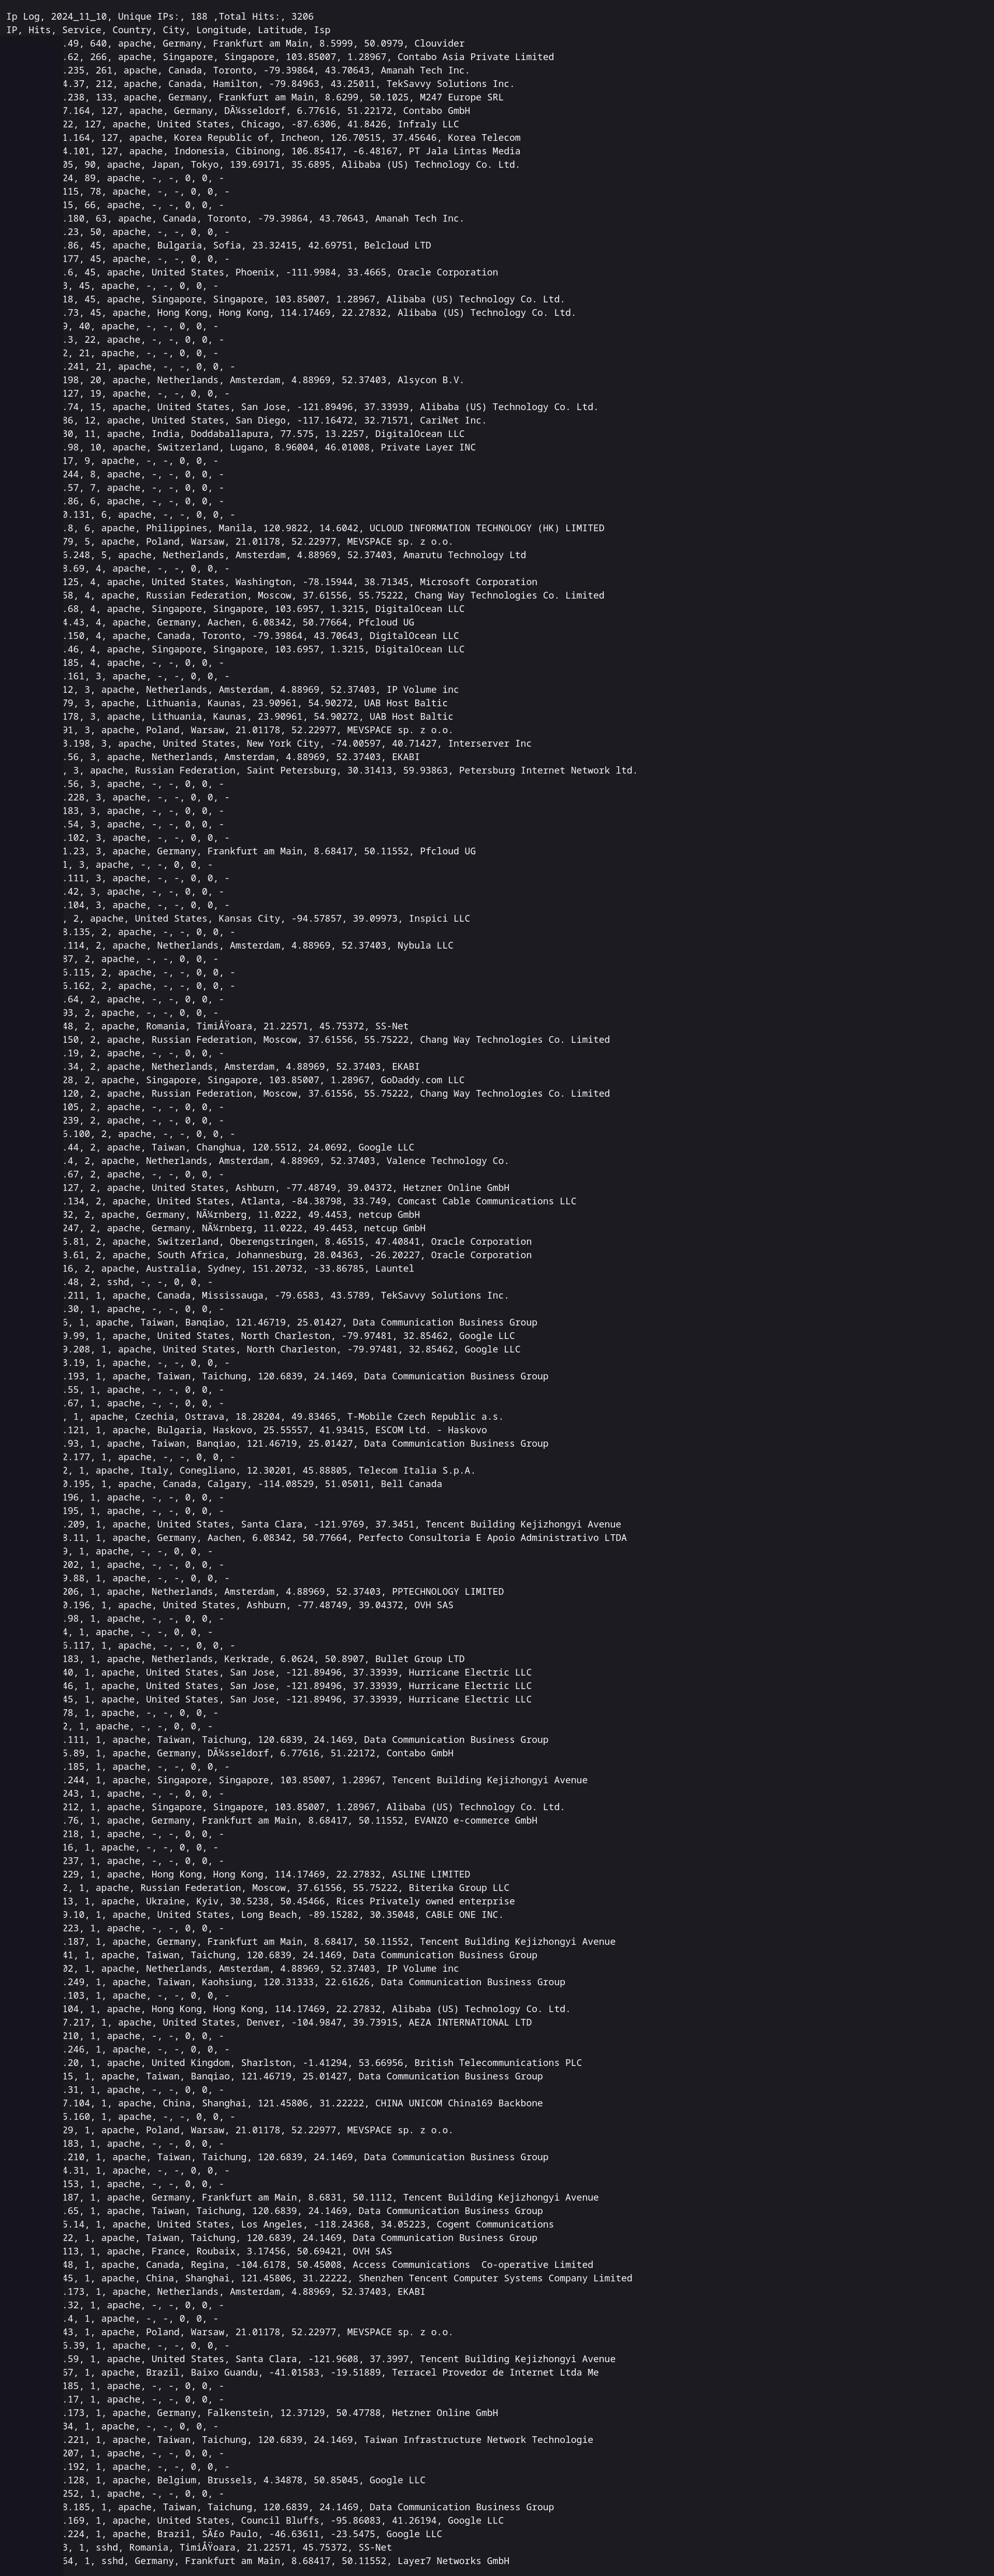
Clicking the map on the home page leads to a text file containing a summary of all incoming traffic to apache and ssh. The ssh server is on a high port number and doesn’t see much traffic but occasionally a persistent bot will find it.

Everything but my landing page (this animation in p5.js https://old.reddit.com/r/cellular_automata/comments/1djwjbu/waves_processingorg/ with the text “Hey this isn’t where I parked my car” overlayed) is behind basic auth or better and I have push notifications set up for every ssh login (even my own), in 5 years I have never had a successful login from an attacker, this is not an invitation, have mercy.
All the data is gathered with python scripts and stored in RoundRobinDatabases or, in the case of network data, digested down into a CSV. The climate sensors respond to requests on port 80 with the temperature and humidity separated by a comma to allow for easy polling. The map is generated by looking up the IPs’ information on Shodan then plotting the location data if it was present.
Absolutely none of this is the ideal solution, there are existing projects that cover literally every aspect plus a dozen extra features I could never hope to implement. I wrote as much as I could from scratch just to see if I could, it’s more fun to drive a shitty car that you built than one you bought from the dealer.
Aaaand I accidentally made the UPS database only 24hrs instead of the 10years I had intended. Lucky for me rrdtool has a function to expand an rrd without wiping out the data!


Definitely nothing wrong with that!!
That is pretty much why. I took one programming class in high school (2004) and since then alway enjoyed solving software puzzles.