For a long write up with more data and some reasons for it:
https://bsky.app/profile/did:plc:ql4ykel4bgsqzslwsa3lflh2/post/3lcdewkbmf22w
Keep in mind Russia is a massive country and trains are amazing at transporting freight over long distances. So they have a lot of regions and industries depending on the railroad. Much more so then in most other countries. Some places can hardly be reached by road, but can be reached on train.


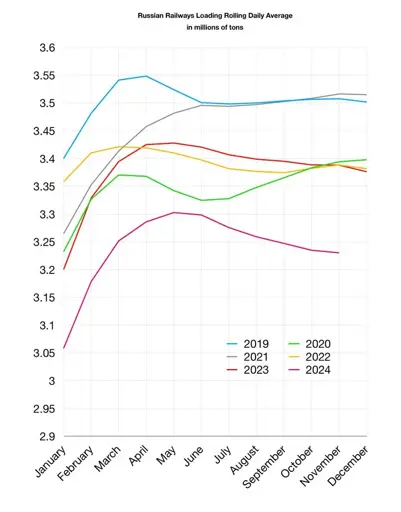
This data doesn’t really make sense… Unless it’s missing data from December for all years and most of the drop happens then, none of the year ends match the following year’s beginning.
But why were the Decembers cut off? Those seem to be the most interesting months…
It looks like they average the daily load for each month. There is only one data point per month. So each January has a lower average daily load than the previous December. The data isn’t continuous but the lines connecting the points make it seem like it is. It’s a poor graphic and should use dots or bars for each data point to be more clear.
Because the the December 2024 numbers aren’t available yet so they did a YTD comparison of January through November for each year. It’s a fair comparison.
The 2024 line already ends earlier than the others, in November.