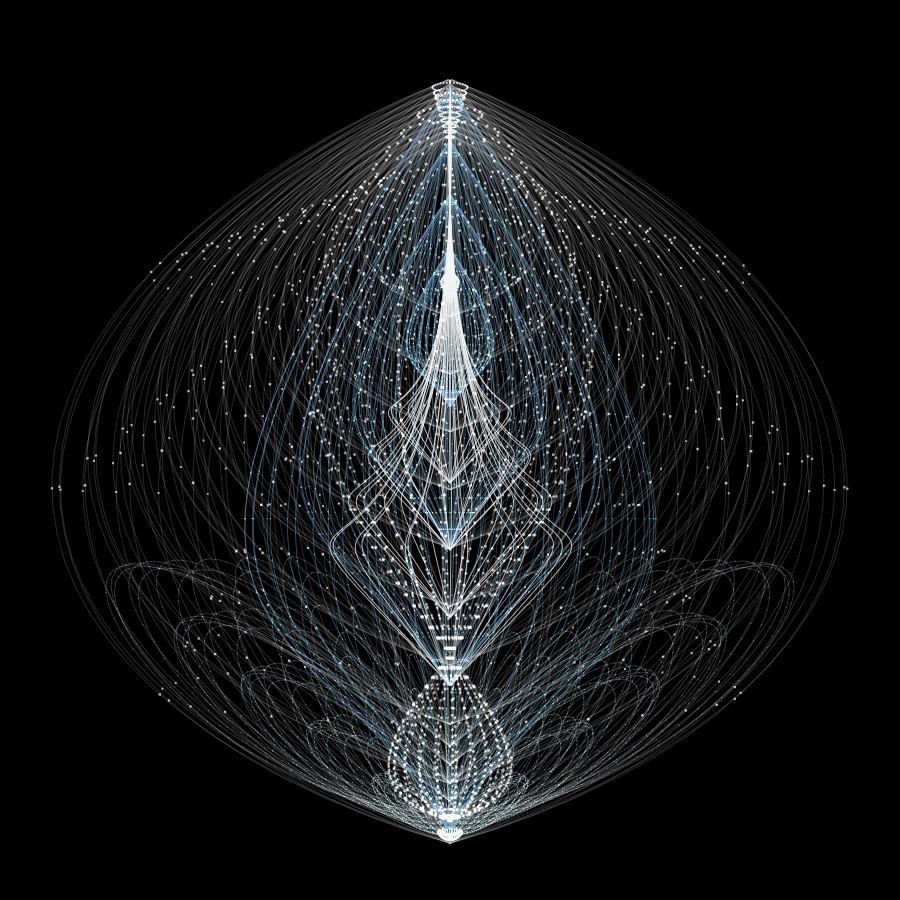
I was unable to upload even the shortest video because it was too long for my instance. Therefore, please enjoy the following:
- Partial visualization of test data. I cut this short because it took 40 seconds to do just a few (out of 81) paths: https://youtube.com/shorts/7UvzgSsMQNA
- Partial visualization of full data. I cut this short because I didn’t want to wait 40 minutes. It’s sped up 2x by making it 60fps (each step is approximately one frame) https://youtu.be/cv9qSdrV2Z4
- Full visualization, but it only shows the end paths, not individual steps: https://youtube.com/shorts/ozQ77ikI7JI
Unfortunately youtube is forcing my videos to be shorts due to aspect ratio and length, I don’t know if I can force them to a regular video


Here’s the code. Everything prefixed with ‘RS’ is from Roassal. Alternatively, just look at where I use
canvas. Keep in mind this is quick spaghetti code, and it includes the full solution for day 10 part 2.day10p1vis: in | input starts canvas | canvas := RSCanvas new. input := CTNewArray2D fromArray: ((in copyWithRegex: '\n|\r' matchesReplacedWith: '') collect: [ :v | v asString asInteger ] as: Array) width: (in lineNumber: 1) size. input withIndexesDo: [ :x :y :val | canvas add: (RSLabel new size: 5; text: val; x: x * 12; y: y * 12) ]. canvas signalUpdate. (canvas @ RSCanvasController) open. 14 seconds wait. starts := (input contents indicesOf: 0) collect: [:v | input indexToCoord: v]. d9heads := OrderedCollection new. ^ starts sumNumbers: [ :s | | thead | canvas signalUpdate. 0.08 seconds wait. d9heads removeAll. thead := RSBox new size: 12; position: s * 12; color: Color red translucent. canvas add: thead. self d9graphvis: input start: s dir: -1@0 canvas: canvas. ]d9graphvis: input start: start dir: dir canvas: canvas | next sum direc bounded bnext | bounded := [ :p | (p x between: 1 and: input width) and: [ p y between: 1 and: input height ] ]. direc := dir. sum := 0. 4 timesRepeat: [ next := start + direc. bnext := RSBox new size: 12; position: next*12; color: Color blue translucent. canvas add: bnext. "canvas signalUpdate." "0.034 seconds wait." sum := sum + ((bounded value: next) ifTrue: [ ((input at: next) = 9 and: [(input at: start) = 8]) ifTrue: [ bnext color: Color green translucent. 1 ] ifFalse: [ (input at: next) = ((input at: start) + 1) ifTrue: [ | t | t := self d9graphvis: input start: next dir: direc canvas: canvas. t = 0 ifTrue: [ self canvasRemove: { bnext } canvas: canvas ]. t ] ifFalse: [ self canvasRemove: { bnext } canvas: canvas. 0 ] ] ] ifFalse: [ self canvasRemove: { bnext } canvas: canvas. 0 ]). direc := direc rightRotated. "canvas signalUpdate." "0.034 seconds wait." ]. ^ sum.Great, thanks! I’ve always had Roassal at the back of my mind as a way of generating visualisations for AOC, but never got round to it. This might kick-start me, but maybe for next year at this point :-)