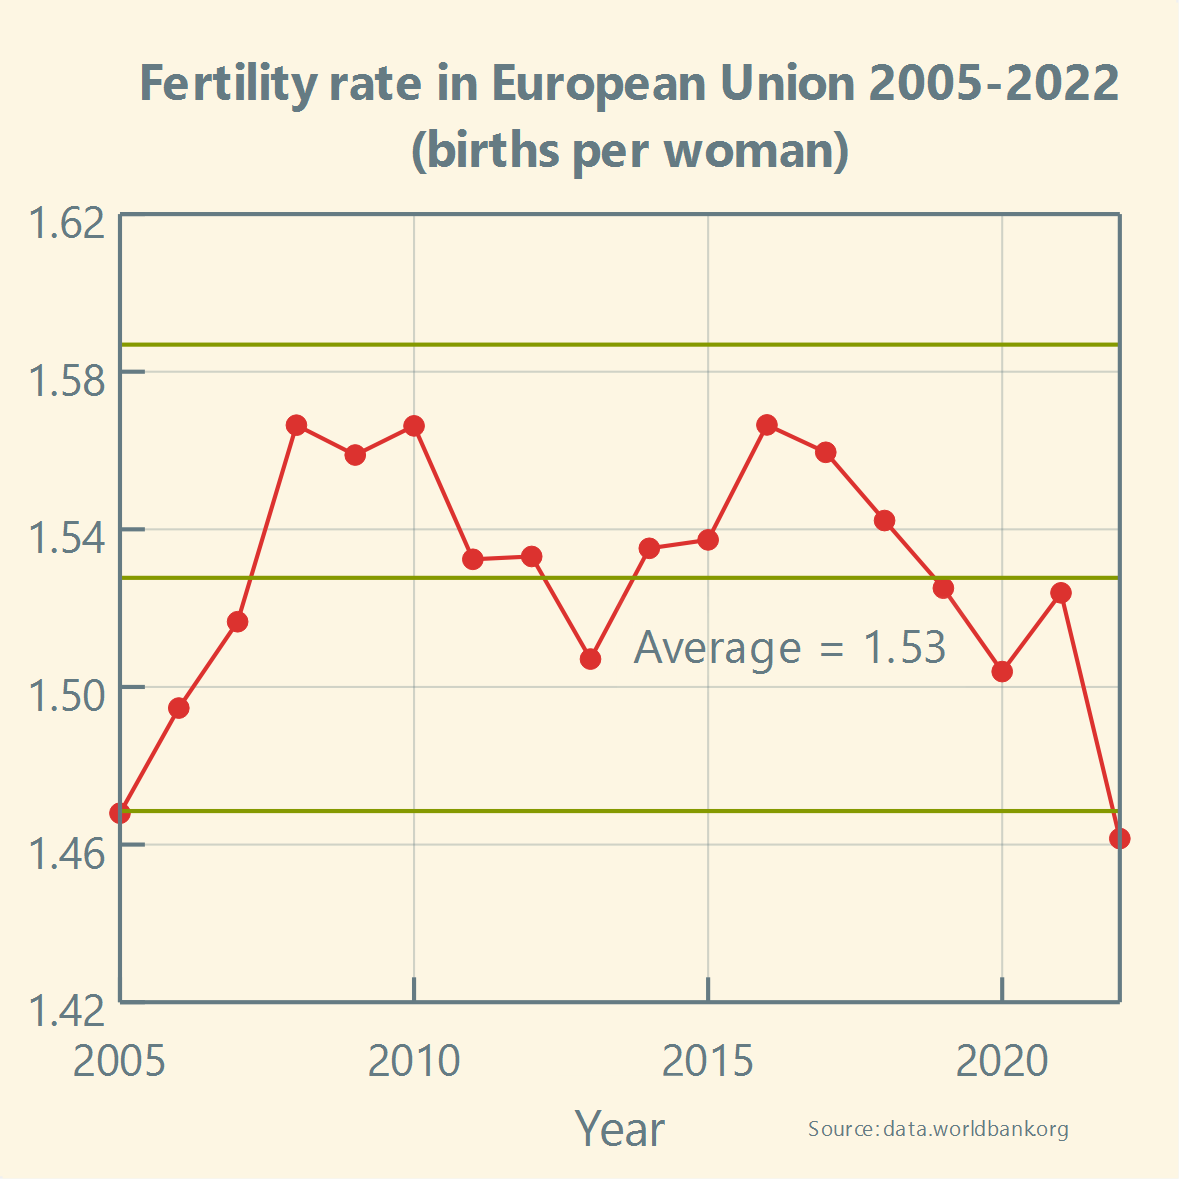
Has the #FertilityRate in the #EuropeanUnion been stable over the past two decades?
A simple #XmR chart available in @LabPlot [2.12dev] can be used to track the stability of any process.
Boosts appreciated! :boost_love:🚀
➡️ https://en.wikipedia.org/wiki/Shewhart_individuals_control_chart
@europesays @dataisbeautiful @[email protected]
#Europe #Future #EU #Europa #Fertility #Politics #Healthcare #Health #BirthRate #Demography #Population #Biology #News #Community #Statistics #FreeSoftware #OpenSource #ControlChart #LabPlot #Data #dataViz
Not starting at zero is a common practice in science and data processing. The difference between bad and good data visualization is in relevance. Good data visualization starts an axis at non-zero numbers because the fluctuation is more relevant than the zero. Bad data visualization hides relevant data to present an alternate takeaway.
Here, a change in birth rate of even 0.1 or 0.2 is a major societal change, and showing that change is more relevant than showing the zero (how would it even be possible that there were zero births in a year, anyways?)
@Contramuffin yes, agreed. And thank for the perspective on the birth rate.