@[email protected]M to Science [email protected]English • 1 day agotransformationsmander.xyzimagemessage-square20fedilinkarrow-up1859arrow-down14
arrow-up1855arrow-down1imagetransformationsmander.xyz@[email protected]M to Science [email protected]English • 1 day agomessage-square20fedilink
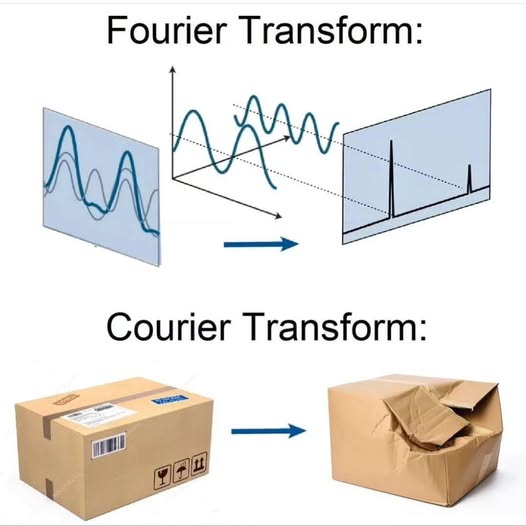
minus-square@untorquerlinkEnglish33•1 day agoStill the best graphical explanation of the Fourier transform. Still wish they just showed this in signals and systems and saved the remaining 3 months of the quarter.
minus-square@[email protected]linkfedilinkEnglish5•13 hours agoYou can also use wavelets to get the middle graph and access the benefit of both spatial and fréquential localization, up to the uncertainty limit!


Still the best graphical explanation of the Fourier transform. Still wish they just showed this in signals and systems and saved the remaining 3 months of the quarter.
You can also use wavelets to get the middle graph and access the benefit of both spatial and fréquential localization, up to the uncertainty limit!