

Plot explanation
-
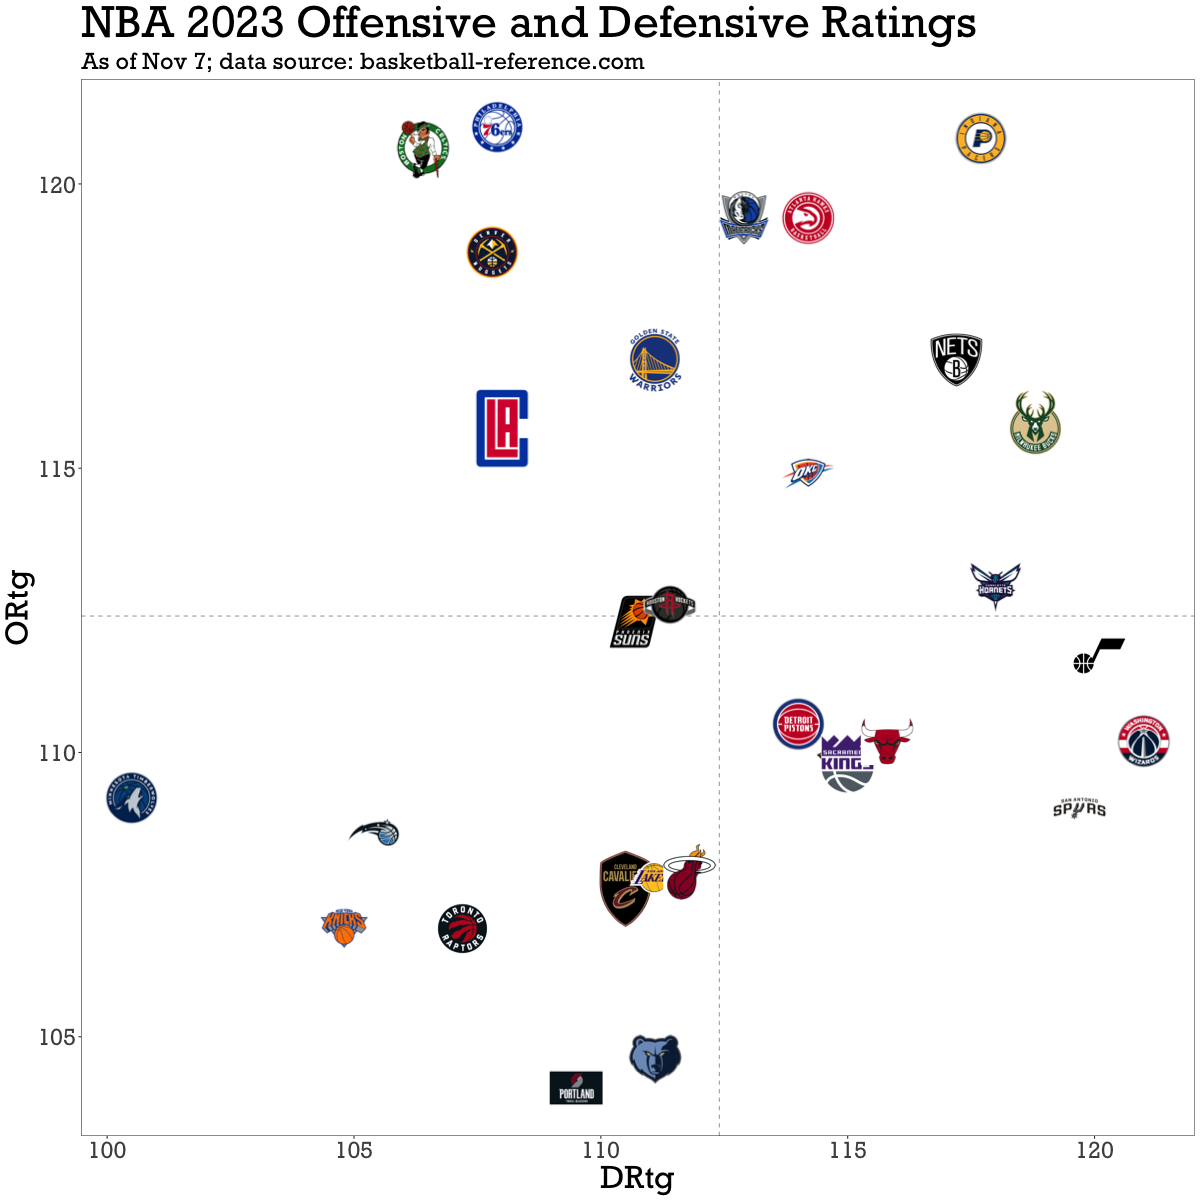
ORtg & DRtg: Offensive ratings (ORtg) are estimates of how many points teams score per 100 possessions, and higher is better. Defensive ratings (DRtg) are estimates of how many points teams’ opponents score on them per 100 possessions, and lower is better.
-
Four quadrants: Teams in the top-left quadrant have the best net rating (estimated point differential per 100 possessions), and teams in the bottom-right quadrant have the worst. The bottom-left quadrant represents teams who are better defensively than offensively, and the top-right quadrant are those who are better offensively than defensively.
Oohh i like this. keep them coming! Though it is unusual to have the best net raying on a top level quadrant.
Have you explored inverting the defensive rating values?
Yeah. It threw me off. I was looking for the Celtics in the top right and it took forever to find them.
Barring major injuries to your team, your Celtics will be in the top right corner next time (I’ll make top-right the good quadrant next time :)
Thanks, I’ve already thought of some improvements for the next one!
I think if defensive rating values are inverted, the best net rating would be top-right and the worst would be bottom-left. That’s probably a more familiar quadrant orientation (it reminds me of math). I might explore some green-red-orange/yellow colour shading. All suggestions are welcome :)