You’re not quite reading the chart as intended. It’s a stacked line chart. The thickness of the section on the y-axis at any point along the x-axis shows the share of the total.
The positioning doesn’t matter, except to show how recently each segment was introduced. New segments are added to the top as they’re introduced in the timeline. Look at handhelds when Nintendo released the Game Boy.
Thank you! This took way too long for me to comprehend. I believe the colored dots right up against the Y axis is what was throwing me off, but your comment helped me get there.
And oddly, it also seems like handheld dipped into near-nothingness even sooner than arcades (perhaps due to things like the Switch and the Steam Deck merging the former field into PCs and consoles, I guess?). How common were arcades when the original version of the Nintendo Switch came out (2017-ish)?
I’d guess that’s correct. Those have incredibly small manufacturing runs for super niche communities, compared to major manufacturers. But also keep in mind these are based on estimates, not omniscient information


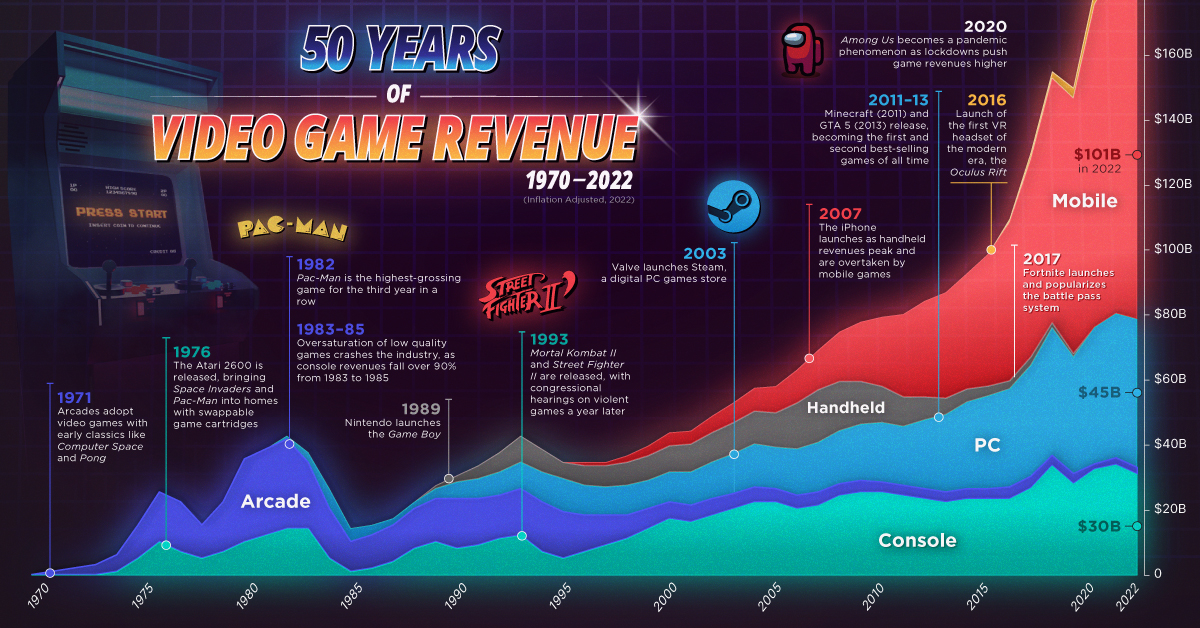
This chart gets hard to read. Why is VR/AR at the top with 5b if it’s the lowest figure?
If true, I am impressed that arcade is doing better than home console.
You’re not quite reading the chart as intended. It’s a stacked line chart. The thickness of the section on the y-axis at any point along the x-axis shows the share of the total.
The positioning doesn’t matter, except to show how recently each segment was introduced. New segments are added to the top as they’re introduced in the timeline. Look at handhelds when Nintendo released the Game Boy.
Arcade is a sliver today, as you’d expect.
Thank you! This took way too long for me to comprehend. I believe the colored dots right up against the Y axis is what was throwing me off, but your comment helped me get there.
And oddly, it also seems like handheld dipped into near-nothingness even sooner than arcades (perhaps due to things like the Switch and the Steam Deck merging the former field into PCs and consoles, I guess?). How common were arcades when the original version of the Nintendo Switch came out (2017-ish)?
Switch and steam deck ARE handhelds for me… so the chart seems poorly defined.
Practically non-existent except in niche settings
So I’m guessing the chart is telling me that non-phone-nor-Switch/Deck handhelds don’t even have a niche scene, by comparison?
I’d guess that’s correct. Those have incredibly small manufacturing runs for super niche communities, compared to major manufacturers. But also keep in mind these are based on estimates, not omniscient information
It’s a stacked bar chart (i.e. each category’s 0 is the top of the previous category and not the base of the graph).
Arcades made 2 billion vs the console’s 30 billion, and VR’s 5 billion in 2022.