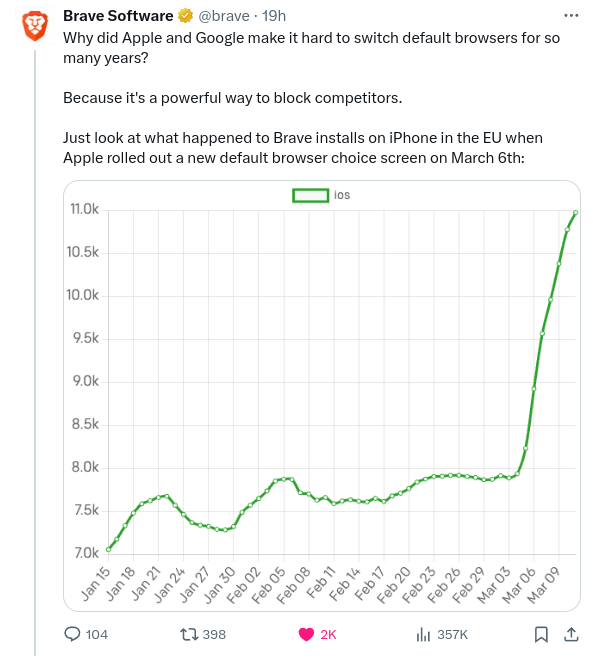
@FatCat to TechnologyEnglish • 1 year agoThe DMA already having an impact. Brave Browser installs surge after introduction of browser choice splash screen on iOS.imagemessage-square275arrow-up11.16Karrow-down176file-text
arrow-up11.09Karrow-down1imageThe DMA already having an impact. Brave Browser installs surge after introduction of browser choice splash screen on iOS.@FatCat to TechnologyEnglish • 1 year agomessage-square275file-text
minus-square@[email protected]linkfedilinkEnglish120•1 year agoChart is a little misleading starting at 7% instead of zero, but still a nice surge nevertheless.
minus-squarebody_by_makelinkfedilinkEnglish29•1 year agoThat’s why they started with the one they did
minus-squarePirkylinkEnglish17•1 year agoEven then, this is still a solid 30-40% increase in downloads. That’s statistically significant right there.
minus-square@[email protected]linkfedilinkEnglish2•1 year agoDoes not look as nice, but is way less misleading
minus-square@scarabiclinkEnglish1•11 months agoThe total numbers are so small that the shape of the line barely matters. 7-10k installs daily? In the mobile browser market? There are plant identification apps with better numbers.
minus-square@matticusrexlinkEnglish17•1 year agoIs that 7% or 7,000 installs total? The axis isn’t labeled!!
minus-squarePirkylinkEnglish46•1 year agoI see a k following the numbers, so I’m assuming that’s total number of downloads.
minus-square@KinglinklinkEnglish-4•1 year agoNot even seven percent. Lol. Seven thousand which is probably like .0001 percent.
minus-square@the_kung_fu_emulinkEnglish8•1 year agoThat’s new daily installs though, so cumulative number. I don’t think they’re trying to draw a comparison, just show the increase.


Chart is a little misleading starting at 7% instead of zero, but still a nice surge nevertheless.
True. Other people asked so they posted another one.
IMO, this makes it look even worse.
That’s why they started with the one they did
Even then, this is still a solid 30-40% increase in downloads. That’s statistically significant right there.
Removed by mod
Worse, or… “better”?
Does not look as nice, but is way less misleading
The total numbers are so small that the shape of the line barely matters. 7-10k installs daily? In the mobile browser market? There are plant identification apps with better numbers.
Is that 7% or 7,000 installs total? The axis isn’t labeled!!
I see a k following the numbers, so I’m assuming that’s total number of downloads.
Article states installs per day
Not even seven percent. Lol. Seven thousand which is probably like .0001 percent.
That’s new daily installs though, so cumulative number. I don’t think they’re trying to draw a comparison, just show the increase.