@[email protected] to Data is BeautifulEnglish • 1 year agoConceptualjlai.luimagemessage-square20fedilinkarrow-up1219arrow-down111
arrow-up1208arrow-down1imageConceptualjlai.lu@[email protected] to Data is BeautifulEnglish • 1 year agomessage-square20fedilink
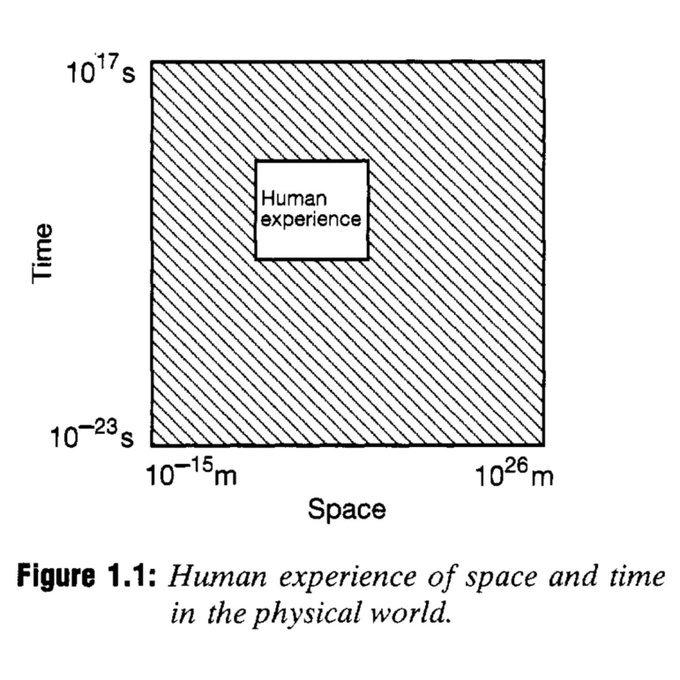
minus-square@DroggelbecherlinkEnglish26•1 year agoWith only two numbers written down we technically don’t know whether it’s linear or log
minus-square@[email protected]linkfedilinkEnglish3•1 year agoCouldn’t one figure it out based on the box being signed slightly to the left of and above center?
minus-square@DroggelbecherlinkEnglish10•1 year agoI mean yeah, with prior knowledge of/ intuition for the data. Which in general shouldn’t be presumed when presenting a graph. But I’m being nit picky
minus-square@PrinceWith999EnemieslinkEnglish4•1 year agoThat’s not being nit picky at all in my opinion. The chart is objectively terrible. I’d be Reviewer Number 2 on this one.
minus-square@tomi000linkEnglish0•edit-21 year agoIf its linear the Human Experience is located around -5*10^22s - -3*10^22s and 3*10^25m - 6*10^25m (whatever that would even be supposed to mean). Doesnt seem right to me. But yes, technically youre right
With only two numbers written down we technically don’t know whether it’s linear or log
Couldn’t one figure it out based on the box being signed slightly to the left of and above center?
I mean yeah, with prior knowledge of/ intuition for the data. Which in general shouldn’t be presumed when presenting a graph. But I’m being nit picky
That’s not being nit picky at all in my opinion. The chart is objectively terrible. I’d be Reviewer Number 2 on this one.
If its linear the Human Experience is located around -5*10^22s - -3*10^22s and 3*10^25m - 6*10^25m (whatever that would even be supposed to mean).
Doesnt seem right to me. But yes, technically youre right