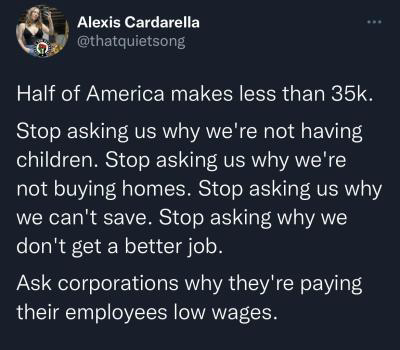
It appears that the claim that half of Americans make under $35,000 is not accurate. According to the U.S. Census Bureau, the median personal income in the United States for 2022 was $40,480 (FRED - https://fred.stlouisfed.org/series/MEPAINUSA646N). Additionally, data from DQYDJ shows that at the 40th percentile, income was approximately $58,001, suggesting that less than half of the population earns under $35,000 (DQYDJ – Don’t Quit Your Day Job - https://dqydj.com/average-median-top-household-income-percentiles/).
Furthermore, the median household income was reported to be $74,580 in 2022, a figure that significantly exceeds the $35,000 threshold (Census.gov - https://www.census.gov/library/publications/2023/demo/p60-279.html). This indicates that the median individual and household incomes in the U.S. are both higher than $35,000, disproving the initial claim.
Only 46% of the population are working. https://www.minneapolisfed.org/article/2022/whos-not-working-in-the-us-learn-the-basics
So technically, technically the quote is correct. The stat you are quoting is the median salary of someone working full-time is $58,001. So it leaves out all those people un and underemployed or who just gave up on joining the workforce. Idk where you got the 40,480 because your link just goes to a broken link. Millennials are also making less money are less likely to be married and have higher unemployment numbers than gen x so our numbers would be more screwed than the overall median which is what the original tweet was referencing when saying stop asking us about buying houses or having kids.
If you are saying half of america then the population usually includes everyone who is alive not just people 25-54, everyone needs money to live. But if you took that subset of the population (not sure why you would have an upper bound of 54 when most people retire at 65+) that still makes the point of half make less than 35k. The median is from full time employed people. Also someone driving for Uber who makes 60k gets counted as making 60k when a lot of that goes towards work expenses like gas and car maintenance.
For you and [email protected], isn’t the Census bureau a national survey with self reporting that only covers like 1% of the population? Both “Fred” and dqydj.com use the Census bureau to calculate their viewpoints from what I understand? If I’m reading the government site wrong or looking at the wrong surveys please correct me. I understand the “Census” to be more of a judge or indicator of patterns but not to be used as concrete data in which to come to solid conclusions from.
I had ran into the census pdf as well before seeing this link, the beginning has an interesting passage which none of the authors seem to mention in the articles,
Real median household income was $74,580 in 2022, 2.3 percent lower than the 2021 estimate of $76,330. It was 4.7 percent lower than the 2019 median, the year before the start of the COVID-19 pandemic and the corresponding recession (Figure 1 and Table A-1).6 The estimate of median household income in 2019 was the highest since 1967 source
Also an important caveat,
The income estimates in the main sections of this report are based on the concept of money income, which is pretax and does not account for the value of in-kind transfers. Estimates of post-tax income and inequality are included in Appendix B. Real median post-tax household income exhibited a substantial decline in 2022 from 2021. This was due in part to the expiration of policies introduced in response to the COVID-19 pandemic, such as Economic Impact Payments and the expanded Child Tax Credit.
I’ve been reading over a few of the articles from www.dqydj.com and it feels very sketchy. I can pinpoint a few questionable passages that seem to pass on an intent, but in general how they dissect the data always has a “but we left out this part” footnote. It’s especially hilarious with the article you linked,
What was the median household income? In 2023, $74,202 was the median household income in the United States. This is up from $70,181 in 2022 (unadjusted for inflation – see below).
They then proceed below to show a graph that completely contradicts their statement.
The paragraph above it makes a great copy-pasta though. If I’m reading any of this wrong, let me know.
Median weekly earnings of full time workers is over $1100/week now, so the median full time worker is probably making well over $50k/year, if they can hold down a job for the full year and work full time hours.
Lots of people don’t work because they don’t want to work, and don’t need to work: retirees, students, married to rich spouses, etc. Including them in the denominator can be helpful for measuring some things, but would be misleading to assume that the median individual income across all individuals would mean what most commenters in this thread seem to think it means.
If you look at what they count as full-time jobs, And then you compare that to how many people are actually willing to offer full-time jobs rather than just a job that takes all of your time you might better understand this.
The numbers are manipulated by what they choose to exclude. And $50,000 in today’s dollars is less than an elevator operator made during the Great depression.

It appears that the claim that half of Americans make under $35,000 is not accurate. According to the U.S. Census Bureau, the median personal income in the United States for 2022 was $40,480 (FRED - https://fred.stlouisfed.org/series/MEPAINUSA646N). Additionally, data from DQYDJ shows that at the 40th percentile, income was approximately $58,001, suggesting that less than half of the population earns under $35,000 (DQYDJ – Don’t Quit Your Day Job - https://dqydj.com/average-median-top-household-income-percentiles/).
Furthermore, the median household income was reported to be $74,580 in 2022, a figure that significantly exceeds the $35,000 threshold (Census.gov - https://www.census.gov/library/publications/2023/demo/p60-279.html). This indicates that the median individual and household incomes in the U.S. are both higher than $35,000, disproving the initial claim.
Only 46% of the population are working. https://www.minneapolisfed.org/article/2022/whos-not-working-in-the-us-learn-the-basics So technically, technically the quote is correct. The stat you are quoting is the median salary of someone working full-time is $58,001. So it leaves out all those people un and underemployed or who just gave up on joining the workforce. Idk where you got the 40,480 because your link just goes to a broken link. Millennials are also making less money are less likely to be married and have higher unemployment numbers than gen x so our numbers would be more screwed than the overall median which is what the original tweet was referencing when saying stop asking us about buying houses or having kids.
Shouldn’t you be taking out children, students, retired people, and those who are unable to work?
The number is 76% if you only look at people aged 25-54.
If you are saying half of america then the population usually includes everyone who is alive not just people 25-54, everyone needs money to live. But if you took that subset of the population (not sure why you would have an upper bound of 54 when most people retire at 65+) that still makes the point of half make less than 35k. The median is from full time employed people. Also someone driving for Uber who makes 60k gets counted as making 60k when a lot of that goes towards work expenses like gas and car maintenance.
If the median household income is 75k, assuming dual-income, then that’s probably where the 35k comes from: 75k/2 = 37.5k.
But there are significant amount of households who just have one person making 75K instead
so per worker, it’s actually 59K according to the data
https://www.bls.gov/news.release/wkyeng.t02.htm
You’re mixing measurements. Household != Individual.
For you and [email protected], isn’t the Census bureau a national survey with self reporting that only covers like 1% of the population? Both “Fred” and dqydj.com use the Census bureau to calculate their viewpoints from what I understand? If I’m reading the government site wrong or looking at the wrong surveys please correct me. I understand the “Census” to be more of a judge or indicator of patterns but not to be used as concrete data in which to come to solid conclusions from.
I had ran into the census pdf as well before seeing this link, the beginning has an interesting passage which none of the authors seem to mention in the articles,
Also an important caveat,
I’ve been reading over a few of the articles from www.dqydj.com and it feels very sketchy. I can pinpoint a few questionable passages that seem to pass on an intent, but in general how they dissect the data always has a “but we left out this part” footnote. It’s especially hilarious with the article you linked,
They then proceed below to show a graph that completely contradicts their statement.
The paragraph above it makes a great copy-pasta though. If I’m reading any of this wrong, let me know.
are you trying to make me feel worse?
Median weekly earnings of full time workers is over $1100/week now, so the median full time worker is probably making well over $50k/year, if they can hold down a job for the full year and work full time hours.
Lots of people don’t work because they don’t want to work, and don’t need to work: retirees, students, married to rich spouses, etc. Including them in the denominator can be helpful for measuring some things, but would be misleading to assume that the median individual income across all individuals would mean what most commenters in this thread seem to think it means.
If you look at what they count as full-time jobs, And then you compare that to how many people are actually willing to offer full-time jobs rather than just a job that takes all of your time you might better understand this.
The numbers are manipulated by what they choose to exclude. And $50,000 in today’s dollars is less than an elevator operator made during the Great depression.
Isn’t that just anyone who works more than 35 hours per week?
What do you mean by this?
Either way, they track several different alternative measures. One is the number of people who want to work full time but are stuck working part time for economic reasons, which has been lower the last few years than the previous decade.
Or if you’d want to look at those who hold multiple jobs, that’s been climbing but still historically low.