

- cross-posted to:
- bicycling
The average modern person, by one calculation, spends more than 1,600 hours a year to pay for their cars, their insurance, fuel and repairs. We go to jobs partly to pay for the cars, and we need the cars mostly to get to jobs. We spend four of our sixteen waking hours on the road or gathering the resources for the car.
Since the average modern American, by one estimate, travels 7,500 miles a year, and put in 1,600 hours a year to do that, they are travelling five miles per hour. Before people had cars, however, people managed to do the same – by walking.
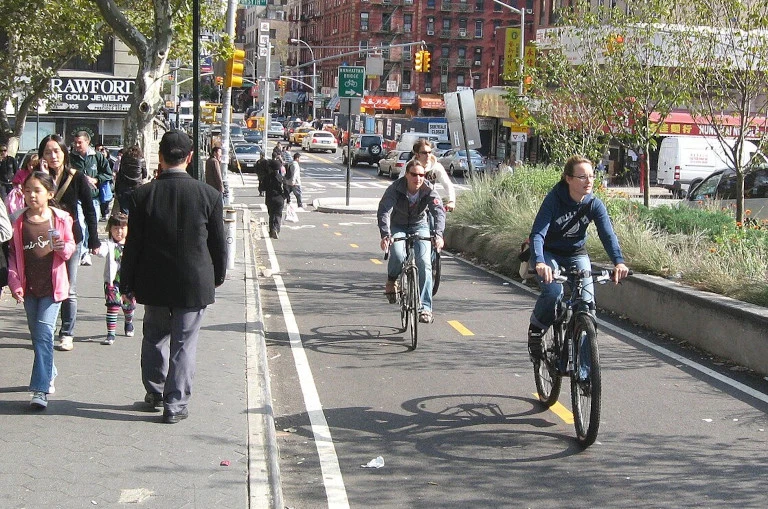
By contrast, a person on a bicycle can go three or four times faster than a pedestrian, but uses five times less energy in the process.
That 1,600 hour number seems weird to me.
Looks like they took AAA’s annual estimate of the “true” cost of a new car $12,182 (https://newsroom.aaa.com/2023/08/annual-new-car-ownership-costs-boil-over-12k/) and divided by the federal minimum wage of 7.25 to get ~$1,680 or "more than 1,600)
Median weekly income in the US is $1139 (https://www.bls.gov/news.release/pdf/wkyeng.pdf), which at 40 hours would be $28.47 per hour. or, 428 hours a year to pay for the car. Granted that is taking a broad median stat and assuming it equates to 40 hours of work, but that’s sort my problem. The whole exercise is just one assumption piled on another from the original AAA number to my own math…
It’s some napkin math but I don’t think it changes the outcome. If we go by 428 hours per year, that’s still 17.8 days which is a lot.
The true cost of car ownership you cited was from 2023 and since then insurance premiums and car costs have continued to increase. AAA which could be considered biased, doesn’t include the medical expenses and legal fees involved in car crashes either.
This a great read on the topic, which I pulled a quote from:
AAA appears to include insurance and that would cover some of those medical and legal fees. But that’s sort of my problem we can pull all sorts of numbers into this and push the stats around. Just the infrastructure costs of highways and bridges alone would extremely favor bicycles, but that would also require ignoring all the other use cases for roads (shipping, ambulances, etc.)
I don’t doubt that bicycles are much cheaper and much better (overall) economically compared to cars. I just doubted the numbers and methodology of the source.
You say that as if car-dependent zoning doesn’t force even minimum-wage workers to own a car. Maybe it’s a worst-case instead of an average, but that doesn’t make it unrealistic.
https://earlyretirementextreme.com/speeding-and-transportatio.html
Another post basically doing the same concept.