Thank you to everyone who took the time to fill out the census! This was an exciting year, and for a lot of users it was their first year on lemmy.ca (and the fediverse in general).
For this census, the questions were more open ended, and it ended up being much harder to do data cleaning and analysis. However, it worked well as the first census because it gave us insight into what we might want to do differently in the future.
Some images may be hard to read, so please open them in a new tab to see them in full size.
The turnout was good, with 531 total responses in the 1 week that the census was open. That made up around 8% of the ~6500 total users on lemmy.ca, which feels like a nice sample size for some fun analysis.
To start off, here is a chart of the responses over time:
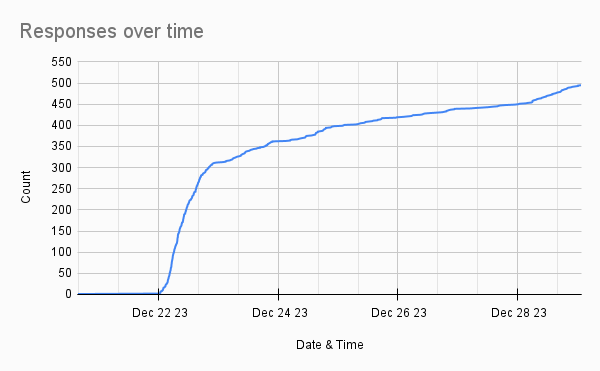
This one is pretty self explanatory, so moving on to the actual results!
Section 1: Where is everyone?
Question 1.1: Where are you from?
This question was broken down into a few parts.
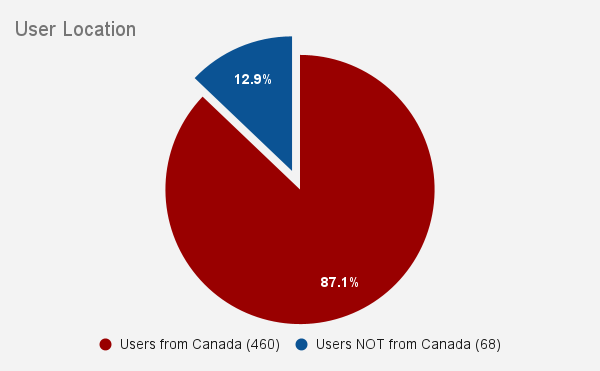
Most users (~87%) are from Canada:
Next we can see which province and territories are represented (sorted by the number of responses):
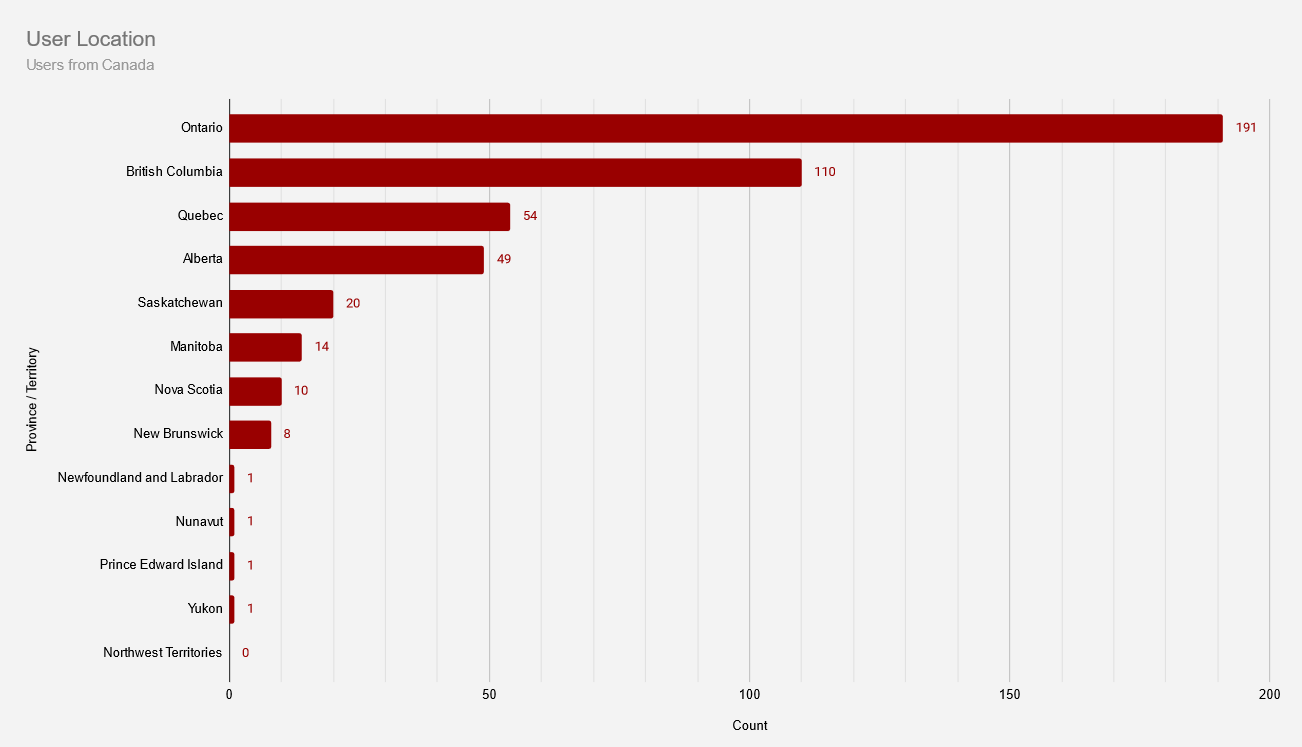
If we compare to the population of Canada, this instance is somewhat consistent with the population distribution with some exceptions (if someone does a proper comparison, please share it! ). We have users from every province and territory, with the exception of Northwest Territories. The NWT community does have subscribers, so hopefully by next year we should have a response from there as well.
Next we can see where the users from the rest of the world are from (sorted by the number of responses):
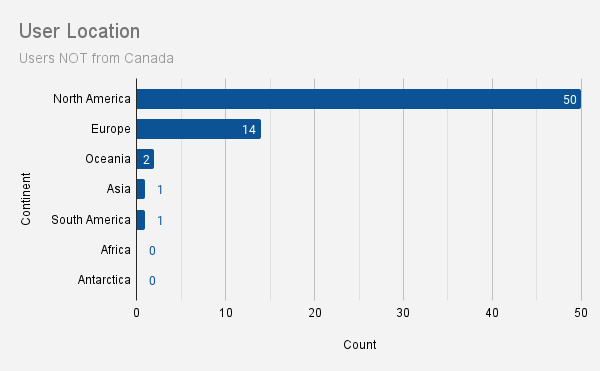
Thanks for spending time on lemmy.ca everyone!
Question 1.2: How big is your community?
A handful of users (13) entered “suburban” as a custom response, so that could be something to add in the future:
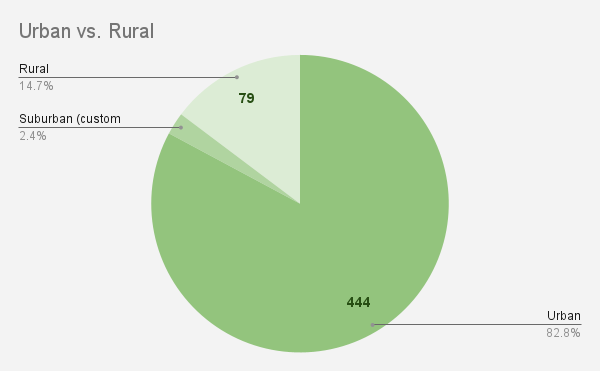
However, what’s interesting is that our results are very similar to the proportions reported by Statistics Canada for the 2021 Canadian census. We had 82.8% urban, 14.7% rural, and 2.4% other, while the 2021 Canadian census reported ~82.15% urban and ~17.8% rural (source).
Question 1.3: In your opinion, what is the quality of your internet connection?
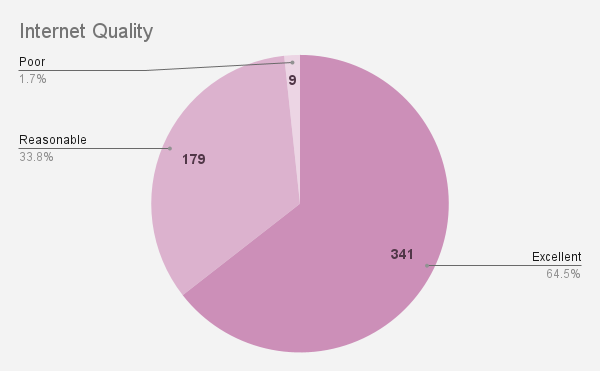
To help those that don’t have excellent internet, you can do small things like reducing the size of images before uploading them.
Section 2: Who are you?
Question 2.1: What age range do you fall into?
There was a lot of interest in seeing the results for this question:
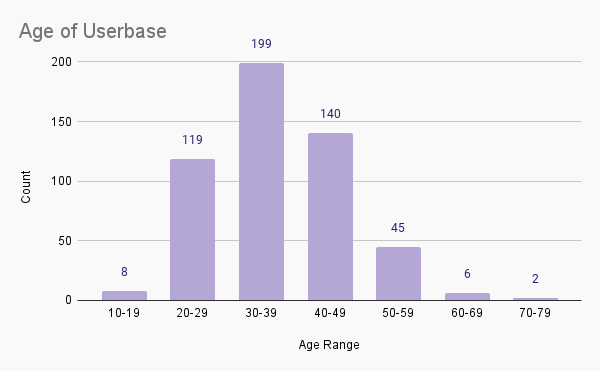
We can see a nice curve, with a peak around 30-39. So the average age on Lemmy is likely a bit older than other social media platforms, but there’s a good spread nonetheless.
Question 2.2: Ethnicity?
This was one of the questions that I couldn’t analyze the way I was originally planning to. While allowing for multiple responses and user submissions allowed for more accurate self-identified responses, it made it difficult to visualize the data in a meaningful way. This data deserves a more in depth analysis, but for now I opted to create a word cloud so we could get a sense of what the responses were like.
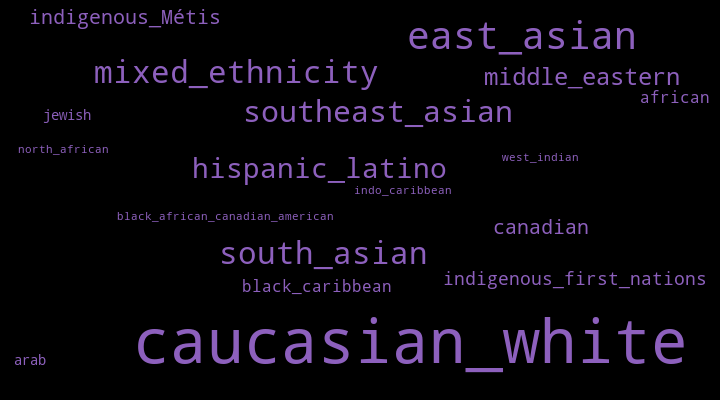
NOTE: For this question and others that used a word cloud, I used this project to generate the results locally.
See the note at the bottom on potential bias and misleading results.
The command I used for this graphic:
wordcloud_cli --text text.txt --imagefile wordcloud.png --prefer_horizontal 1 --width 720 --margin 10 --height 400 --colormask colormask.jpeg --random_state 5 --relative_scaling 0.4
Question 2.3: What is your gender identity?
With this question, we can see that a large proportion of users identify as ‘Man’ (441), followed by ‘Woman’ (32), ‘Non-Binary’ (25), ‘Genderfluid’ (3), and the remaining responses were custom responses (1).
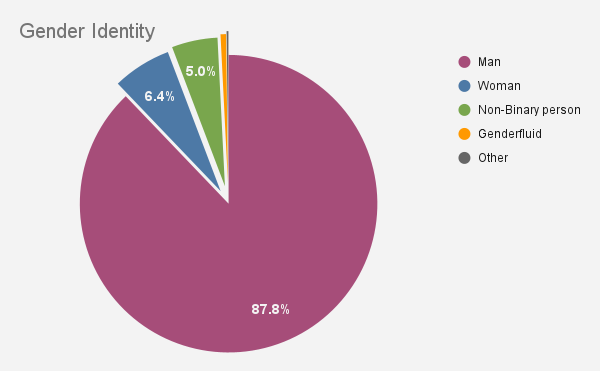
This is something that could use more analysis and comparison as the instance continues to grow.
Question 2.4: Are you someone with trans experience (meaning your gender identity does not align with your sex assigned at birth)?
In case it is hard to see from the graph, the breakdown was ‘No’ (472 | 93.8%), ‘Yes’ (28 | 5.3%), and the rest of the responses were custom responses (4 | 0.9%).
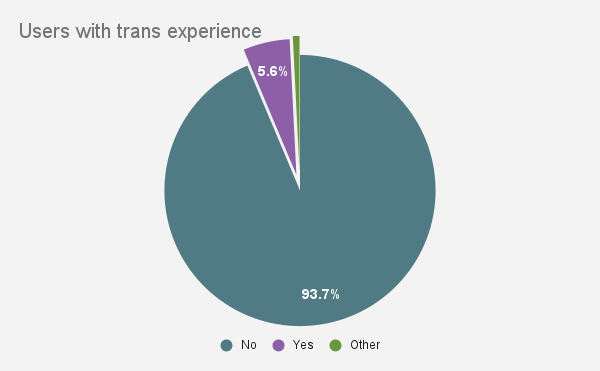
You can see Canadian census data for ‘Sex at birth and gender’ here: https://www.statcan.gc.ca/en/census/census-engagement/community-supporter/sex-birth-gender
Question 2.5: How do you identify?
Similar to the other question above, this question allowed for multiple responses and user submissions, so it was difficult to visualize the data in a meaningful way.
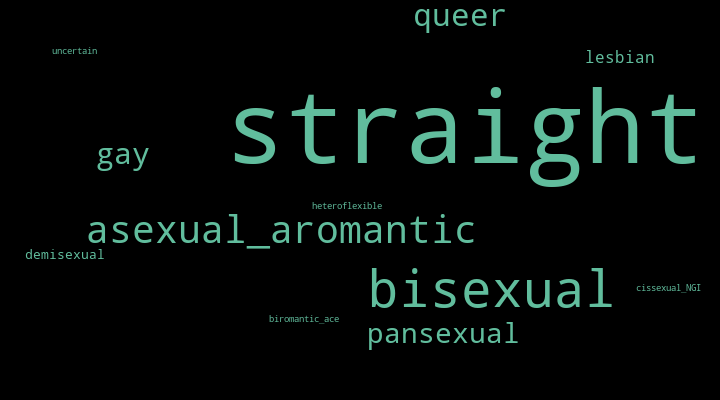
See the note at the bottom on potential bias and misleading results.
The command I used for this graphic:
wordcloud_cli --text text.txt --imagefile wordcloud.png --prefer_horizontal 1 --width 720 --margin 10 --height 400 --colormask colormask.jpeg --random_state 6 --relative_scaling 0.55
Question 2.6: Disability Status (optional)
As this was an optional question with free responses and a small number of responses overall, I opted to manually clean the results and list out details from the responses. Hopefully this is still useful while also respecting the privacy of the respondents.
- “ADHD”
- “anxiety”
- “ASD/autism”
- “AuDHD”
- “bipolar disorder”
- “BPD”
- “colorblind (protanomaly)”
- “depression”
- “difficulty processing information”
- “fibromyalgia”
- “health decline due to age/life experiences”
- “learning disability”
- “neurodivergence”
- “partial deafness”
- “PTSD”
- “sensory issues”
- “struggles with mental health”
- “vascular Ehlers-Danlos syndrome”
Question 2.7: Educational Background
For this question, multiselect really didn’t make sense. Some users included everything, and others picked their highest level of education. Instead, I manually cleaned all the results to answer “What is your highest level of education?”. Other details that aren’t captured in the graph include entries that highlighted that the program was in progress, or that they dropped out. With that in mind, I had to make some choices about how to clean the data, and my choices may not reflect the original intent of the respondents.
Next time should be better, as we can split this into a few questions:
- Highest level of education achieved
- School is in progress?
We could keep the multiselect option since ‘highest level of education’ doesn’t get the full picture. We could also add “CÉGEP diploma”, “College diploma”, and “Other degree/diploma” as options.
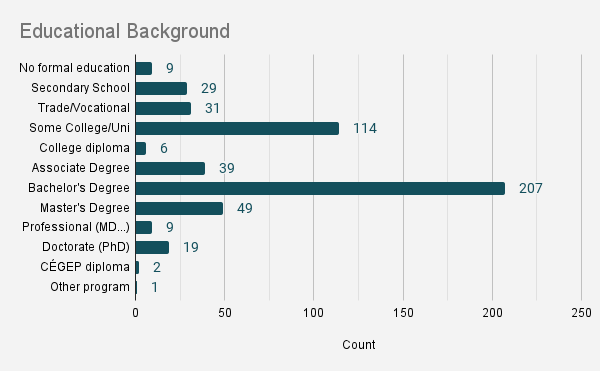
Here are the raw counts for each of the original options:
- No formal education 8
- Secondary School 93
- Trade/Vocational Training 52
- Some College/University (no degree) 120
- Associate Degree 42
- Bachelor’s Degree 223
- Master’s Degree 55
- Professional Degree (MD, JD, MBA) 10
- Doctorate (PhD) 19
Question 2.8: Employment Status
We got a few custom responses, including ‘active duty military’, ‘disability’, etc. Those were included in the ‘other’ category, and we could add those options in the future.
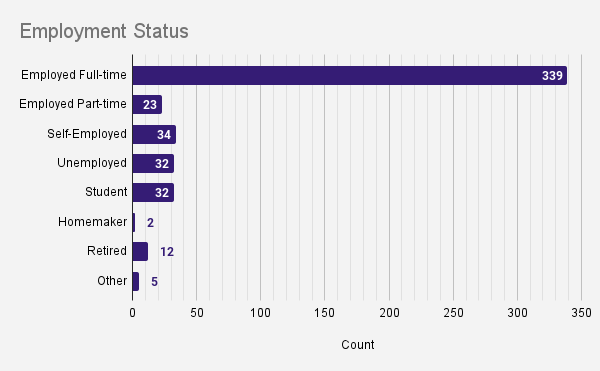
The percentages are as follows:
- Employed Full-time: ~70.8%
- Employed Part-time: ~4.8%
- Self-Employed: ~7.1%
- Unemployed: ~6.7%
- Student: ~6.7%
- Homemaker: ~0.4%
- Retired: ~2.5%
- Other: ~1.0%
Question 2.9: Field of Work
This question was… a mess to try and clean and display. I tried to collapse as many similar responses as I could, but it felt like I was making more mistakes than I was fixing:

The command I used for this graphic:
wordcloud_cli --text text.txt --imagefile wordcloud.png --prefer_horizontal 1 --width 720 --margin 10 --height 400 --colormask colormask.jpeg --random_state 150 --relative_scaling 0.35
See the note at the bottom on potential bias and misleading results.
Section 3: Instance Usage
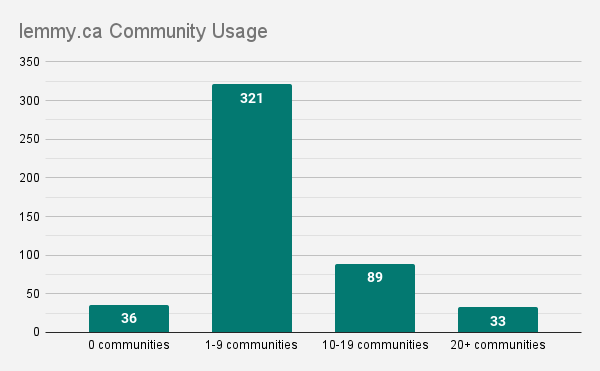
Question 3.1: Approximately how many lemmy.ca communities do you participate in?
Question 3.2: If you moderate any communities on lemmy.ca, how many do you moderate?
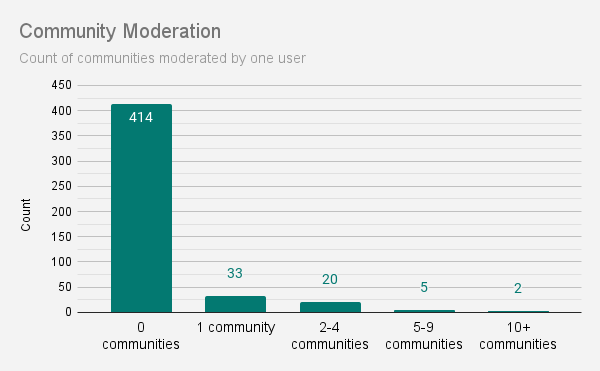
This one should be a number entry in the future.
Question 3.4: What community do you want to see on lemmy.ca? (optional)
Personal information was cut out and responses were split into multiple lines as appropriate. If I accidentally cut your response or you want to add something now, please comment below!
List of Requests
- amigurumi
- Analog photography
- anything urbanism, climate change, waste reduction/RE use etc related would be nice to have more activity
- Apple
- Birds, lots of birds
- Ottawa
- Author and book promotion help
- Batman
- DC comics
- bicycles
- binge eating disorder
- buildapcsales
- Canadian and local news
- Canadian Deals (software and other)
- Celeste community
- Chess
- Coffee
- Communities focued on discusison of specific video games, especially Paradox games and From The Depths
- fiction-writing and sharing communities
- dota2
- edmonton
- EMS
- Fibromyalgia or chronic illness communities
- Fine arts related
- First Nations-based communities
- French Canadian content
- FrugalCanada
- Furry
- gameboy verification. Those guyz were awesome and hard workers
- gaming sites
- more healthcare communities
- Hockey
- Hockey is a bit dead IMO
- HumansBeingBros
- I think you should leave
- Kamloops local
- knitting and similar things (crafts, etc.)
- Less with more. The main issue with federation is that there are several communities that cover the same topic. So you end up with fractured groups, or you participate in several communities that all have the same posts.
- Literary
- Loseit
- Maple Leafs
- Montreal
- More craft/art based communities
- more diverse communities
- movies
- nicevancouver
- Non-sided political discussion
- nursing
- personal finance canada
- personal finance canada
- plant and mineral identification communities
- poodles
- printsf
- [email protected]
- Quake Champions
- reading and/or viewing clubs, esp. for lesser known gems
- Reptiles!
- rupaulsdragrace (and variations)
- sasswitches
- Sleep apnea
- Snowboarding
- snowboarding
- Something link with cybersecurity and retro gaming
- Stocks
- superstonk
- Survivor
- Thoughtful conversation, although not very balanced currently.
- Unsolved mysteries
- Vancouver
- Vancouver
- Various fantasy literature ones
- [email protected]
- Wallpapers or art curation
- Wearable/smart_rings
- What is this thing
- witchesvspatriarchy
- worldnews
While we will also look into these communities, you are free to (and encouraged) to look through this list and get them going 🚀
Question 3.5: On average, how much time do you spend on Lemmy each day?

For the 28 people that said “>21 hours”, here is a video of a baby sea otter taking a snooze (Joey from Vancouver Aquarium). While we love to have you here, feel free to use this video as you take a break and get some rest: https://www.youtube.com/watch?v=JBVT8HWEahM
Question 3.6: How do you access Lemmy most often?
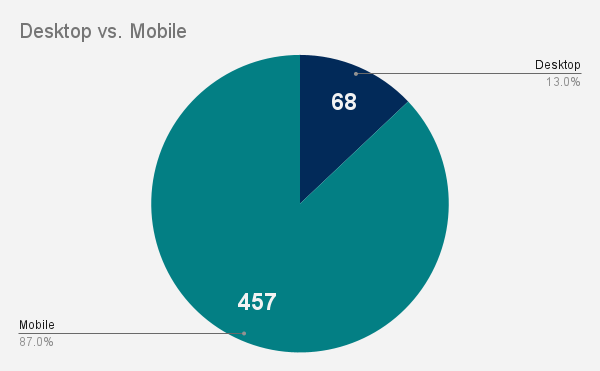
In case it is hard to see from the graph, the breakdown was ‘Desktop’ (68 | 13.0%) and ‘Mobile’ (457 | 87.0%).
Not listed here were the custom responses:
- 3 submissions for “Tablet”
- 3 submissions for “Both about equally” (worded in different ways)
Both of these could be added as options in the future.
Question 3.7: On desktop, which interfaces do you use?
The default interface was the most popular, but each interface was preferred by some number of users.

Question 3.8: On mobile, which OS do you use?
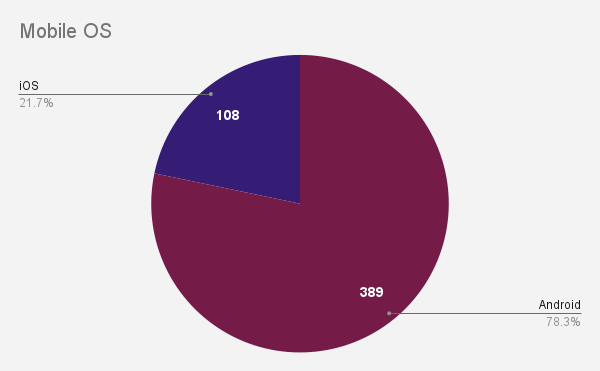
Not listed here were:
- 1 submission for “GrapheneOS”
- 1 submission for “Debian”
- 1 submission for “None”
We could clarify these options in the future.
Question 3.9: On mobile, which app(s) do you use?
These options were submitted by users, and I included them in the graph: Avelon, Artic, Lemmios, Lemmur, Bean.

Not listed in the graph were:
- 22 submissions for “Web Browser” (worded in different ways)
- 4 submissions for “None”
All of these could be added as options in the future.
There were also comments about the lack of tablet apps, so if you’re an app developer, this could be something to take a peek at 👀
Question 3.10: If you primarily access lemmy.ca through different Lemmy/Kbin instance, please list it below (optional)
Thanks for stopping by 😊, here is the list:
- beehaw.org (4)
- bookwormstory.social (1)
- lemmy.dbzer0.com (1)
- lemm.ee (2)
- lemmy.ca (1?)
- Lemmy.ml (1)
- lemmy.dnet.social (1)
- lemmy.world (9)
- kbin.social (1)
- sh.itjust.works (3)
- sopuli.xyz (1)
- startrek.website (1)
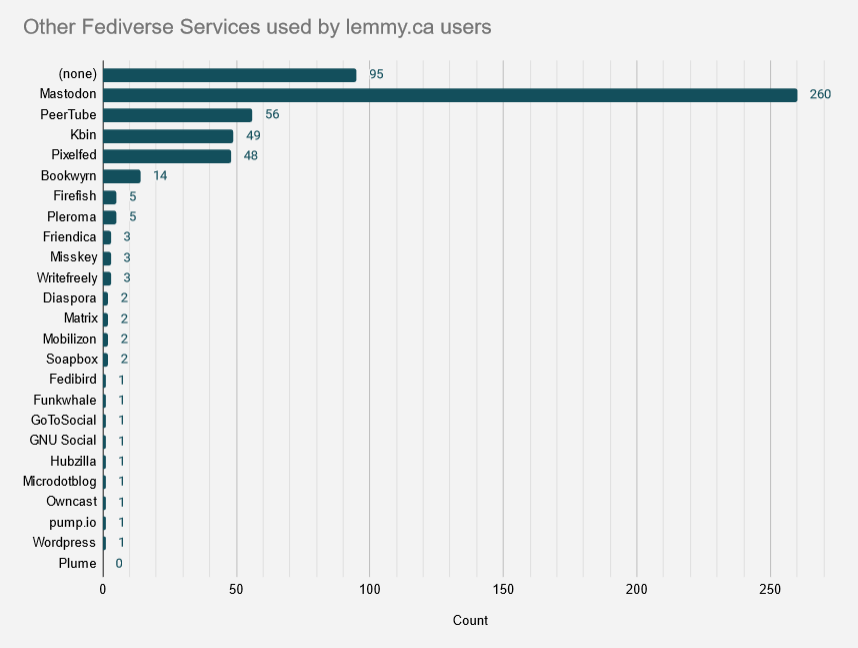
Question 3.11: What other Fediverse services do you use?
This one was sneakily edited to add a “none” option after a few responses came in.
These were custom responses which I added to the graph: Matrix, Owncast, Hubzilla, Diaspora, GNU Social, Funkwhale, GoToSocial, Soapbox, Wordpress, pump.io.
Section 4
Question 4.1: First, what’s your favourite dessert?
Wow this one took a while to go through.
Here are some responses I collected while cleaning (sorry if I lost yours before thinking to do this):
- Anything that has Reese peanut butter cups/pieces in it. Reese is love. Reese is life.
- brownies although I just had some gingerbread men that were pretty bussin
- hard to say. just made some very tasty eggnog cinnamon rolls though
- Either jello formed from the tears of my enemies, or tiramisu. (No I don’t have enemies really, I just thought it just sounded cool.)
- Pie. All of the pies. Except Meringue which is the devil’s dessert topping.
- Lemmings
- The Sahara (I always mix these up)
- chocolate-stuffed chocolate topped with chocolate with a side of chocolate paired with hot chocolate
After cleaning the data, and consolidating similar responses into a format that could easily be searched, I can confidently say that the most popular dessert out of 527 entries was…
ICE CREAM 🍦
kind of…
There were 94 entries for different flavours of ice cream, and 97 total entries for other desserts that included ice cream. This doesn’t even include the entries for things like gelato, frozen yogurt, etc.
- The most popular type was just
ice creamwith 54 entries, second to which wasmint chocolate chipwith 5 entries (with many other flavours having 3-4)
The closest other category was cake, which had 42 entries not including cheesecake, and 96 entries that included the word cake (including cheesecake).
- The most popular type of
cakewaschocolate cake, with 11 entries.
Another close category was pie, with 85 entries for different kinds of pie (not including similar foods such as tarts, crumbles, etc.)
- The most popular pie entries were
piewith 17 entries,apple piewith 15 entries,pumpkin piewith 12 entries (with one specific to the Costco kind),key lime piewith 10 entries,pecan piewith 8 entries, and a few others.
Some other popular desserts/categories included:
applecategory: 25 entriesbrownies: 10 entrieschocolatecategory: 55 entriescookies: 15 entriescrème brûlée: 13 entriesfresh fruitcategory: 9 entriesnanaimo bars: 11 entriestiramisu: 23 entries
Some unique desserts included: affogato, baklava, beaver tails, blondies, gobi, gajar halwa, mochi, jalebi, knafeh, malassada, mango sticky rice, natas do ceu, pavlova, saskatoon berry pie, pouding chômeur, sachertorte, stroopwafel, vacherin, vermicelles, and vinarterta. (If you think your entry should be here, send me a message 😄)
Even a lot of the joke entries had repeats, with 4 entries along the lines of just desserts, 2 entries for your mom, 2 entries for revenge etc.
Additionally, 19 entries did not select anything, with 8 specifying that they couldn’t pick, and 3 specifying that they did not like desserts.
Here is the word cloud (the generator ran into a bug that I couldn’t fix where a lot of entries are duplicated, this will be swapped out when I can fix it):
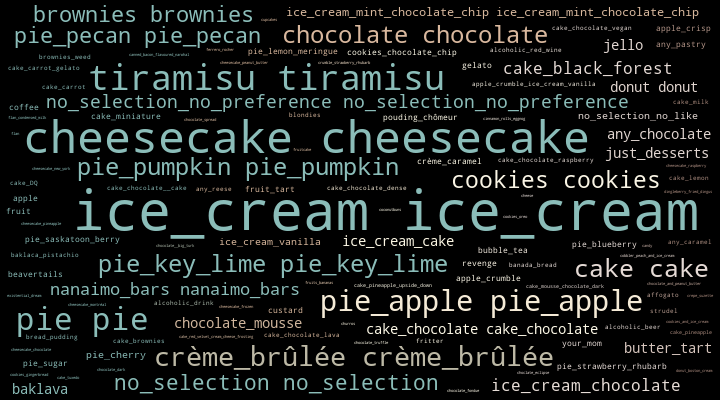
The command I used for this graphic:
wordcloud_cli --text text.txt --imagefile wordcloud.png --prefer_horizontal 1 --width 720 --margin 10 --height 400 --colormask colormask.jpeg --random_state 5 --relative_scaling 0.5
Question 4.2: Do you have any other feedback for us? (optional)
We recieved so many kind words, thank you so much for taking the time to share them! ❤️❤️❤️
In addition to that, here are some other areas with questions, comments and feedback.
Organization Related
- when we will start accepting donations, and many comments about wanting to donate
- the status of the non-profit registration
- possiblity of setting up as a co-op
Technical
- upgrade to 0.19 was a bit bumpy (but otherwise good)
- a few comments about not being able to log in since 0.19 (please try logging out and back in, it should fix it)
- The subscribed feed is preferred, as users may not want the experience to be Canada-focused
- (census specific): “None” should be an option as it is different from “skip”
- a few users didn’t know about the other frontends, so we could do a better job of promoting them
Communities and Content
- More French content / usage
- looking for more guidance on how to grow the communities and build engagement, and other non-monetary ways to help
- local communities could have more informal discussion, as they are currently mostly news articles
Thank you everyone and stay tuned for the next census! 🎉
Appendix / Other Notes
POTENTIAL BIAS / MISLEADING RESULTS: Word Clouds
I had trouble with the word size variability, and I used the relative scaling option to try and make the word cloud more useful and representative while still being readable. This is based on my perception of the raw data, and while I did my best to minimize bias, I may have introduced some. If you have any suggestions for how to improve this in future years, please comment below!
People filled out the census with so much care and detail and these sections deserve nice visualizations. Word clouds are not good mediums for conveying information, so please keep all that in mind when looking at these results.
Shoutout to the gigachad using no operating system on his phone. Other than that I was surprised at the gender breakdown being that one sided.
Almost 90% men. Reddit is also very heavily male dominated, but I am surprised by this stat as well.
It’s… glaringly depressing.
I was surprised as well, and it’s something we can work on as the instance grows
Here’s a post from a few months ago; the comments have decent discussion to work off of:
Discussion on ‘Missing women on Lemmy and decentralised networks’
The guy is just looking at a blackscreen haha
The madlad/lass just pagers their friend who upvotes and types comments on their behalf.
Anything to stay away from that blue light!
color
Blasphemy
color
I actually did a find-and-replace for that halfway through, but then I realized it broke the CLI commands
Mwa ha ha ha.
Us american devs are gonna ensure that everyone spells color with no useless letters.
It’s pretty common for Canadian devs to spell it
colorin code, butcolourall other places. I know I do that.I go one step further and make helper functions that just pass their arguments to the alternatively spelt versions.
no useless letters
kulr
Awesome stuff! I’m shocked of how few fellow ladies are on :P
Same for the age part, I knew it tended to be older, but we are so few under 20
This doesn’t surprise me at all. Compared to most other forms of social media, lemmy is pretty old-school in concept. Like the earliest forms of social media (USENET, FidoNET, forums, mailing lists), it’s based on discussing topics of interest, not following people of interest. Thus, I subscribe to (and post within) “woodworking”, not “Paul Sellers” or “Stumpy Nubs”. (I do follow them elsewhere, though.)
In addition, it’s been pretty close to 20 years since it was standard procedure to go to teenagers for help figuring out “this computer thing” or “this internet thing”. Oh, sure, maybe someone my age can benefit from the knowledge of a teenager when it comes to something like tiktok, but the vast majority of even the over 50s have got all the basics and more figured out.
Taken together with the fact that there are a lot more people over 20 than 10-20, I would have predicted that their numbers would be about the same as for over 60. And that seems to be the case.
I suspect that a better breakdown would be 10-year cohorts starting at age 15 instead of age 10, but that might make population-level comparisons more difficult.
Another way to look at it is that lemmy has more in common with FidoNET than with Facebook or tiktoc. I was using FidoNET in my late teens by dialing into a local BBS before internet became publicly available. I’m 67 now, and have just followed the evolution of “topic discussion” over time.
Compared to most other forms of social media, lemmy is pretty old-school in concept. … it’s based on discussing topics of interest, not following people of interest.
I could never put my finger on why I think most social media sucks, but this is exactly it.
I completely agree, this is why I preferred Reddit despite its issues, and now Lemmy.
One person will never be able to make enough content to cover a whole topic.
Same. Not a lady myself but that one really stood out. Education level one was very interesting too.
I’m a lady on here, I’ve had some very surprisingly negative responses to things I’ve commented that made me think “hmm, not a very gender-balanced audience.”
I’m sorry you had to deal with that, Lemmy has been surprisingly more progressive than Reddit but it still has its problems.
There is other analysis that could have been done, but I felt that people already waited long enough for the results. If there’s something specific you’d like to see, reply to this comment and I’ll see what I can do.
I’ve spent a lot of hours trying to get this right, but there’s always the chance something went undetected. If something looks odd, let me know and I’ll try to fix it when I can.
Out of pure interest, do y’all have plans to release a de-identififed version of the cleansed (or even the raw but that’s even more effort) dataset? I’m not sure how much (if any) pii or potentially identifying information was collected, but there are tools that can help with anonymizing beyond just removing columns. I’m sure there are some data nerds who wouldn’t mind taking a stab at an analysis/data vis themselves.
I totally understand the effort of doing that so no worries if not!
That might be something worth doing in future years :) I considered it this time, even with specific columns like the dessert one, but decided against it.
Next time I’ll read up a bit on how anonymizing should work so that we can do it correctly. Most importantly though, we’ll announce it ahead of time so that users can decide what they want to enter. For this census we said we weren’t going to share the data anywhere so that’s what I’d like to stick with.
I’d love to see others do data analysis and cooler visualizations on instance census data. My visualizations were limited to simple built-in graphs, but there are so many cooler tools out there.
It’s just that I didn’t think about it till after the census had already started
All good, totally appreciate sticking with that promise as well!
Thanks for taking on this project. It was actually pretty interesting to get to know everyone even at a high level. It may not have panned out the way you wanted it, but I’m sure the lessons learned will make each subsequent census that much better!
And for the individual looking for the Ottawa community, we’ve been here the whole time! And yes, it is also mainly news articles at the moment.
Whose favourite dessert was the “chocolate-stuffed chocolate topped with chocolate with a side of chocolate paired with hot chocolate”?
Just asking because I could use a new best friend.
Pretty sure that was Deanna Troi
Sup my 20 SK homies.
YES my suggestion made the list!
Thanks for doing this. The numbers are really interesting.
this is cool. aussie.zone should do this @[email protected]
Next time if you’re comfortable with it under always found the personal and household income questions great from Reddit’s Ontario polls. It helps you understand why the politics are as they are.
Good feedback
I’m thinking next year we can post the proposed questions ahead of time and get some feedback on what options to include
I wish I added this in the suggestion box but can we add “which is your preferred search engine” “which is your preferred operating system?” and “What kind of diet are you on” for next time?
It would be nice to get another statistical data point for these things❤️
Thank you [email protected]!
Those sound great, I added them to our notes for next census!
Awesome, I was really excited for this! Lots of cool data, and a good number of quality responses.
Thanks for putting it together.
Very awesome read! Thanks for making and publishing this. Might be great for other instances as well so we can work on improving the experience of our userbase (and clear up misconceptions).
No problem :)
That was part of my motivation as well, back when I was first thinking about it
I am very surprised at how many people use apps instead of just a browser on mobile
An app allows me to customize things exactly how I want. I originally used Jerboa, then I switched to Boost for Lemmy.
I was originally a Boost for Reddit user before I fled here. The developer announcing that they’d develop a Lemmy app was partially the reason I left as soon as I did, but I was gonna leave regardless.
I just switched from browser to Voyager like two days ago. Markedly easier on my hand, doesn’t have a weird halting scroll like Jerboa, and no ads like Sync. So far, would recommend.
Can it do the basic formatting of Lemmy? A lot of the aps tend to not be able to do super/subscript or spoilers, often showing subscript as strikethough.
**Bold**Bold
*Italic*Italic
~~Strike-through~~Strike-through
~Subscript~Subscript
^Superscript^SuperscriptSpoiler
Message
::: spoiler Spoiler
Message
:::
If the app makes it easier on your hand that’s great! It’s removing a potential barrier to entry for you
nah, it was only able to parse bold, italic, and strikethrough correctly. oh well, lucky me i don’t find the rest of it super important
Sync for Lemmy is incredibly good for browsing .
Does sync display basic formatting correctly?
**Bold**Bold
*Italic*Italic
~~Strike-through~~Strike-through
~Subscript~Subscript
^Superscript^SuperscriptSpoiler
Message
::: spoiler Spoiler Message :::Yup

The spoiler looks a little different, but still does the same thing and is close enough.
Nice to see that one of the apps actually formats text properly.


