

Mangohud works really great for this inside a game, but outside of that I am not sure what to turn to check temps at idle.
I would prefer a GUI tool (QT since I am on Plasma), but I am also comfortable with the terminal. What are you all using?
The default system monitor application that comes with KDE can do this. You will need to click the “edit page” button in the top right, and create a custom layout that shows all the sensors you want. Here is mine:
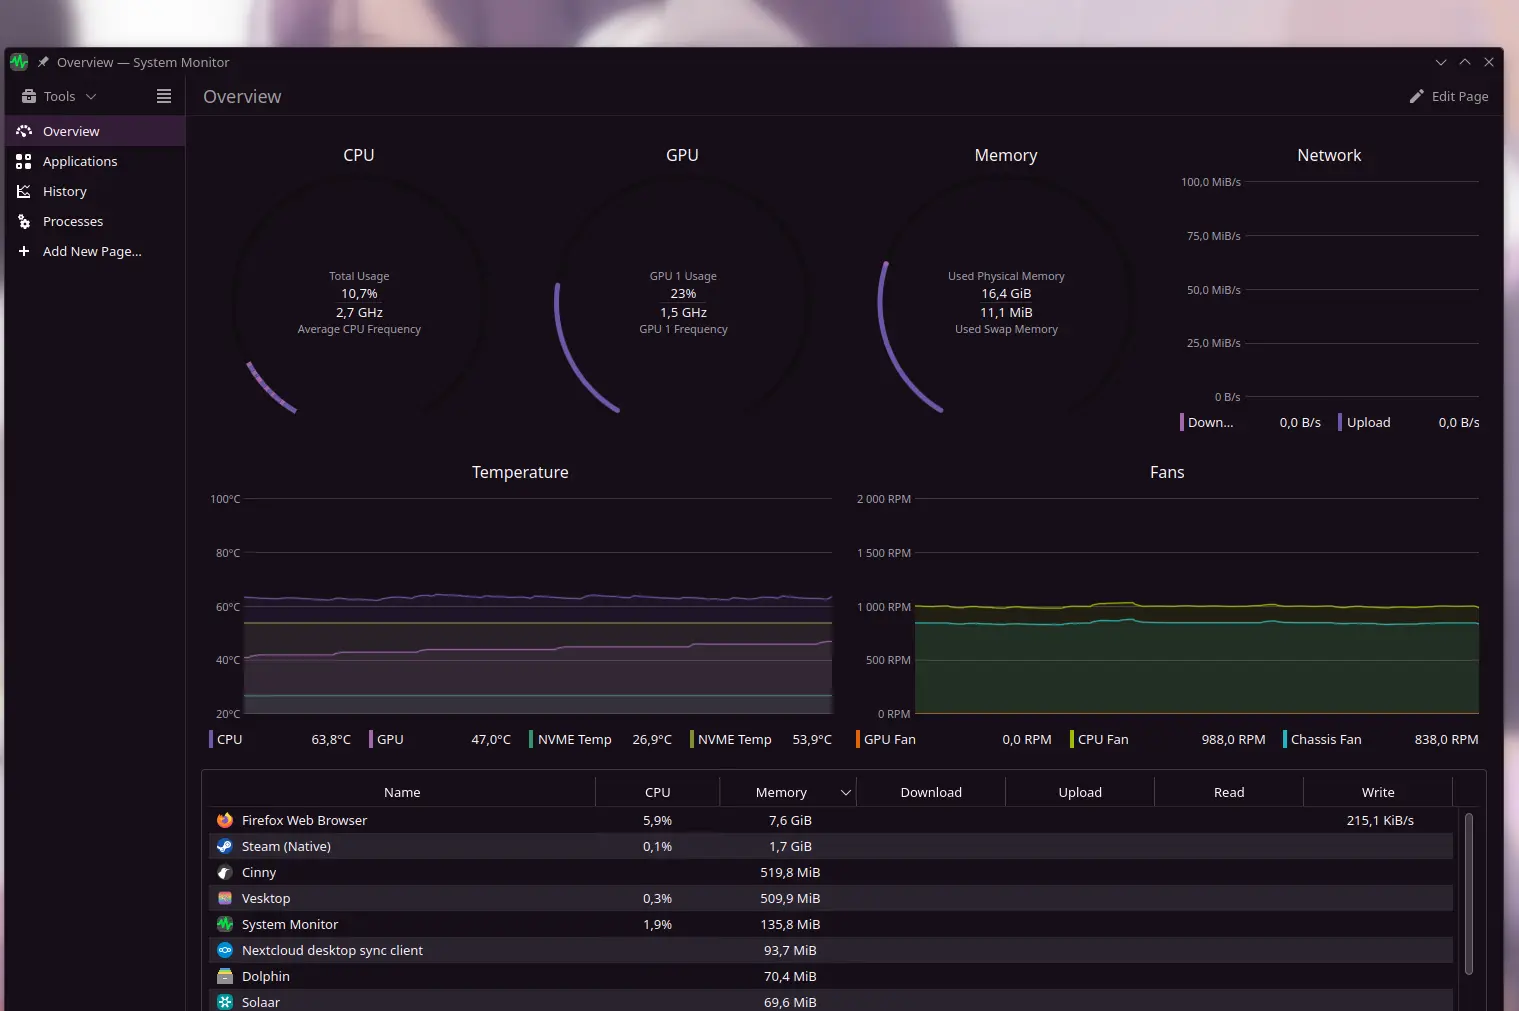
You can display the data using pie charts, text, line charts, etc.
Once you create your layout, you can even turn it into a widget that you can have on your desktop or drop into your taskbar.

Nice I had no idea, thanks for the tip
KDE’s system monitor is absolutely great, I kinda missed it when switching to GNOME because their default system monitor is very lackluster. I’m now using Mission Center instead tho, which is great! It’s basically an almost 1:1 copy of the Windows Task Manager but I think that’s a good thing, Task Manager is one of the few things about Windows that are actually really good IMO.
That’s a cool program thanks for the recommendation.
However, it’s disappointing they don’t have CPU temps on it.Actually there are CPU temps, just missed it the first time I was looking at the program.
Are these dashboard exportable / importable at all? If so can you share you config files?
They are, though the sensors are hardware specific. So while I could export and send you this particular page, it likely won’t show any temps and fan rpms, as the associated hardware wouldn’t be there.
A lot of stuff does work though, like the application list and network graphs, so I could export it for you tomorrow if you like.
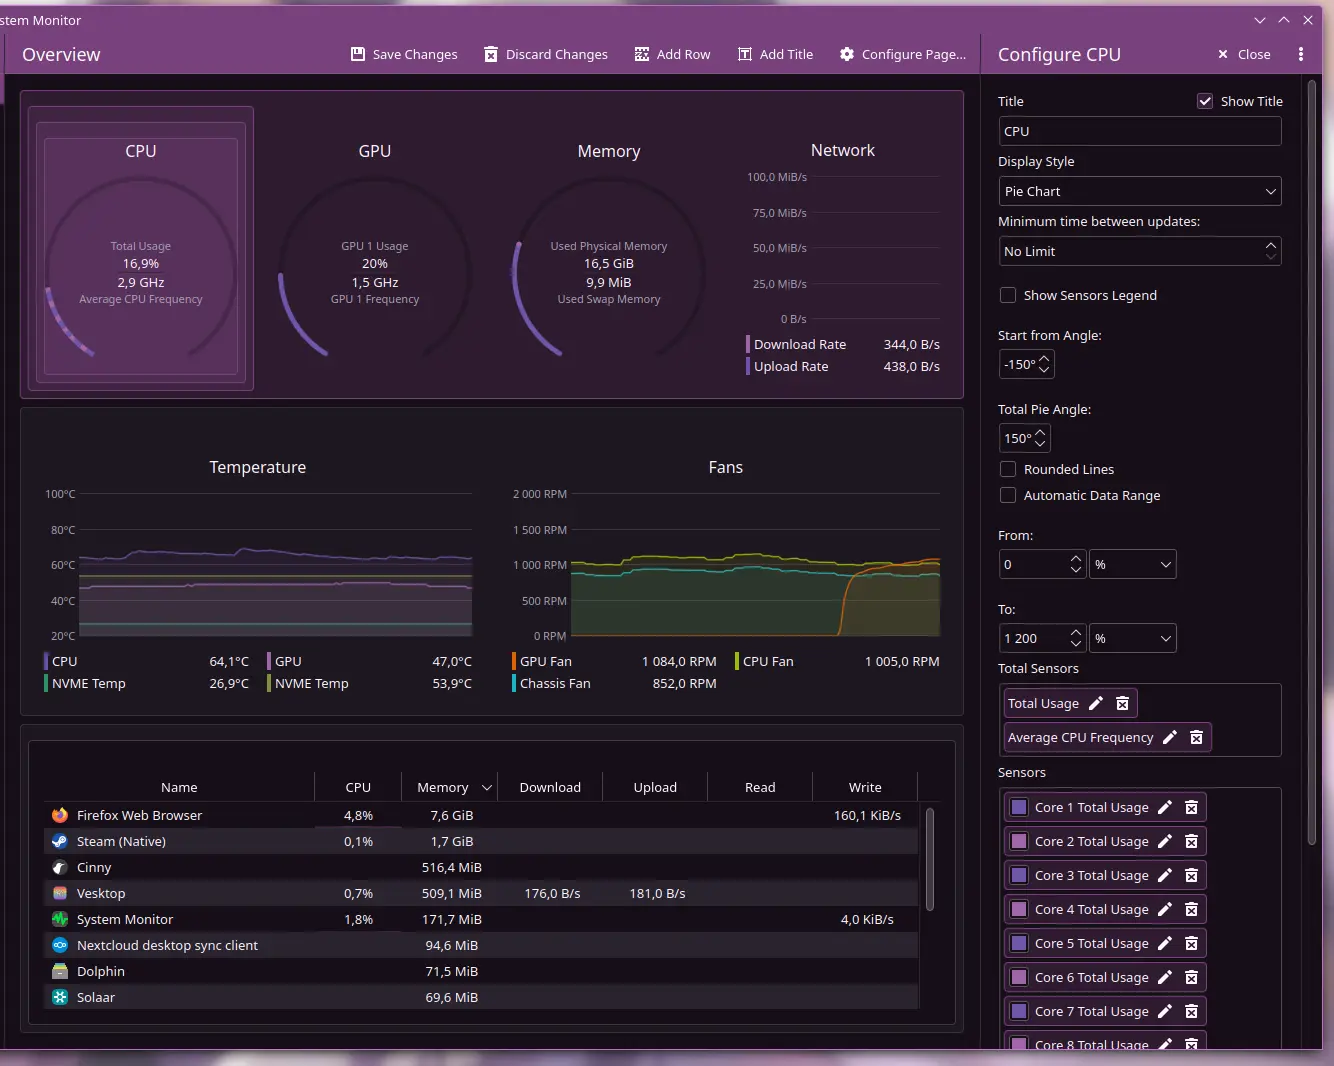
Or I could just explain more about how to configure it, it’s really not that complicated. For a display item, you basically just need to pick a display mode (line graph is good for temps) and then add what sensors you want displayed in it. Everything else is just visual tweaks you don’t have to touch.
btop in the terminal is awesome. It’ll give continuously updated temps for each core as well as the temp at the outlet. Plus, it’s pretty.
Every GUI tool just uses the data from lm_sensors, so you’ll need to install that and have it identify the installed hardware sensors in your computer. After that, you can choose from a variety of GUI front ends; here is the Arch Wiki page with a list of common and popular GUI tools for this purpose.
Thanks! Lm_sensors didn’t appear to be in the opensuse repo, but I will double check because it seems like a lot of things depend on it
I don’t use KDE, but you could try https://gitlab.com/agurenko/plasma-applet-thermal-monitor
Have you tried creating a custom page with the plasma system monitor?
plasma-systemmonitorYou can create a new page to monitor all your temps, then add rows for each sensor you want to monitor, select the chart type or text and then select the sensor itself.
I’m sure there are plenty of guides on how to set it up to get what you want.
Coolercontrol
I use btop + nvtop in tmux as well. Though btop recently added a GPU section, not detailed as nvtop but does the job if you only want to run btop.
Psensor. It’s gui only. I don’t care for the graph so I just resize the window until I only see the numbers.
I was looking for this one earlier, it’s weirdly not in the OpenSuse repo
Looks like it’s not in the official repos, but is in a few community ones: https://software.opensuse.org/package/psensor
For spot checks I just run
sensorsorwatch sensors.
sar -m TEMP | grep amdgpuwhen I want to see history (needs the sysstat cronjob configured to collect sensors data).For amd gpus you may want to take a look at amdgpu_top
Check out CoreCtrl: https://gitlab.com/corectrl/corectrl
Looks cool, don’t want to start using user repos for it though. Wish they had a Flatpak.
I agree but its good software.
Hwmonitor


