Hi everyone, I host a server with few services running for my family and friends. The server freezes sometimes. Where the services stop responding. If I try to ssh into the server, it takes a lot of time (3 to 5 mins) for it to connect. After being connected, every letter I type takes 2 to 3 mins to appear on screen.
Seems like the server is overloaded with tasks. But I am not sure what load it is running. I have netdata installed. I could pull up following screenshots for insights.
Can someone please help me in troubleshooting the issue?
I have tried testing stress testing my RAM and CPU, and they were fine. But I would start troubleshooting from scratch if you have recommendations for testings softwares.
Please also let me know if there is anything I can pull from netdata to help in trouble shooting.
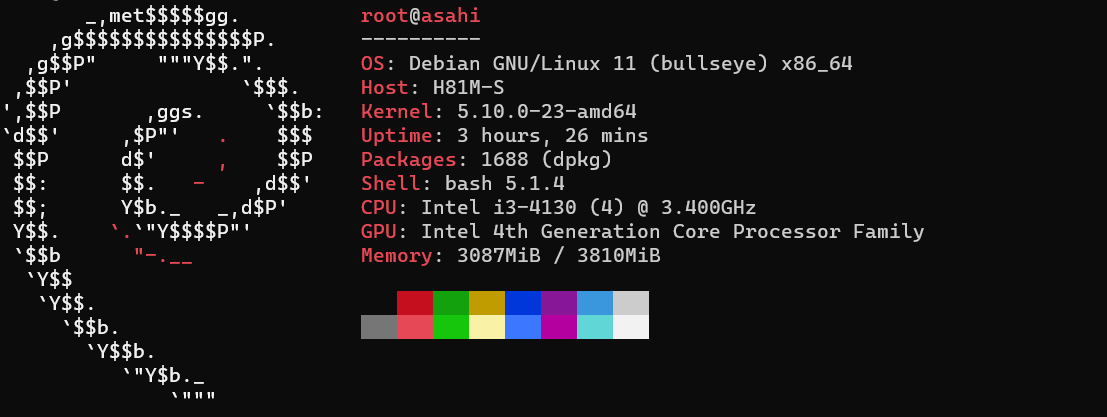
System Specification:

System RAM

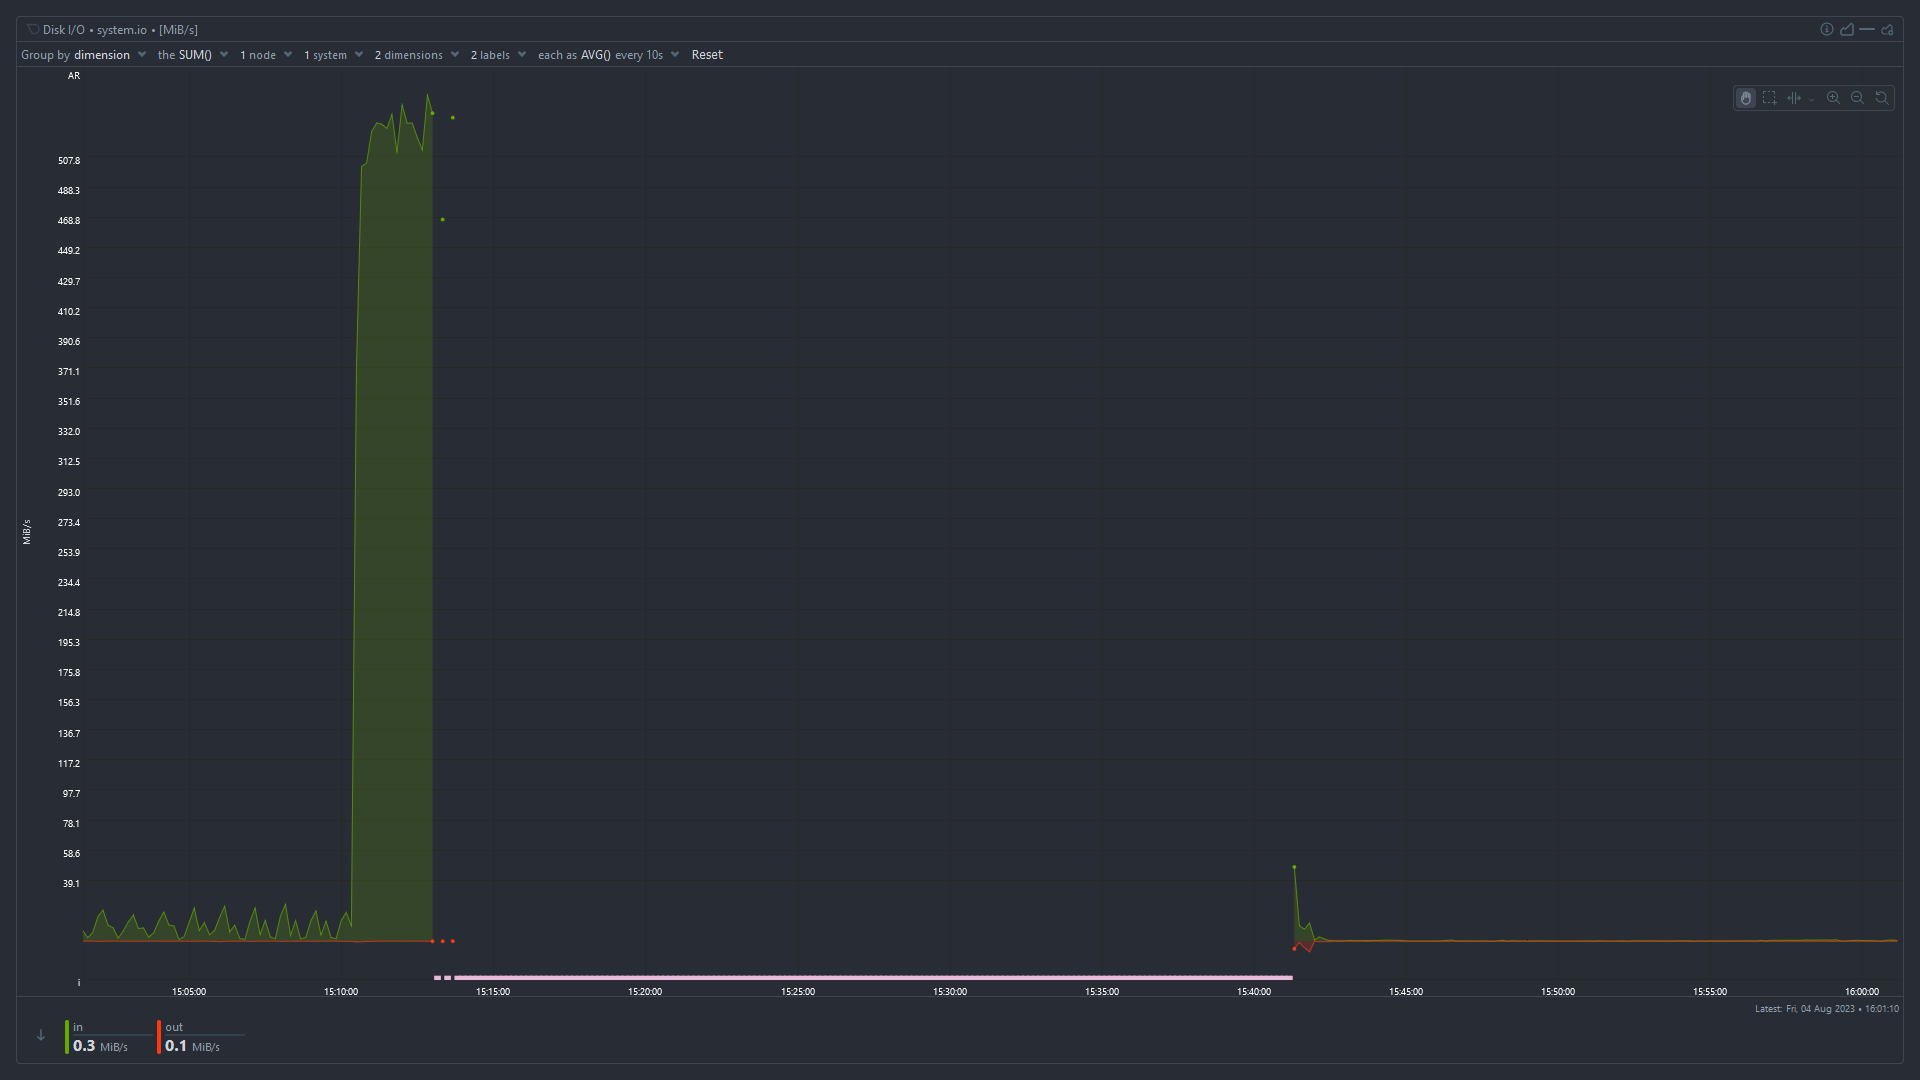
Disk I/O
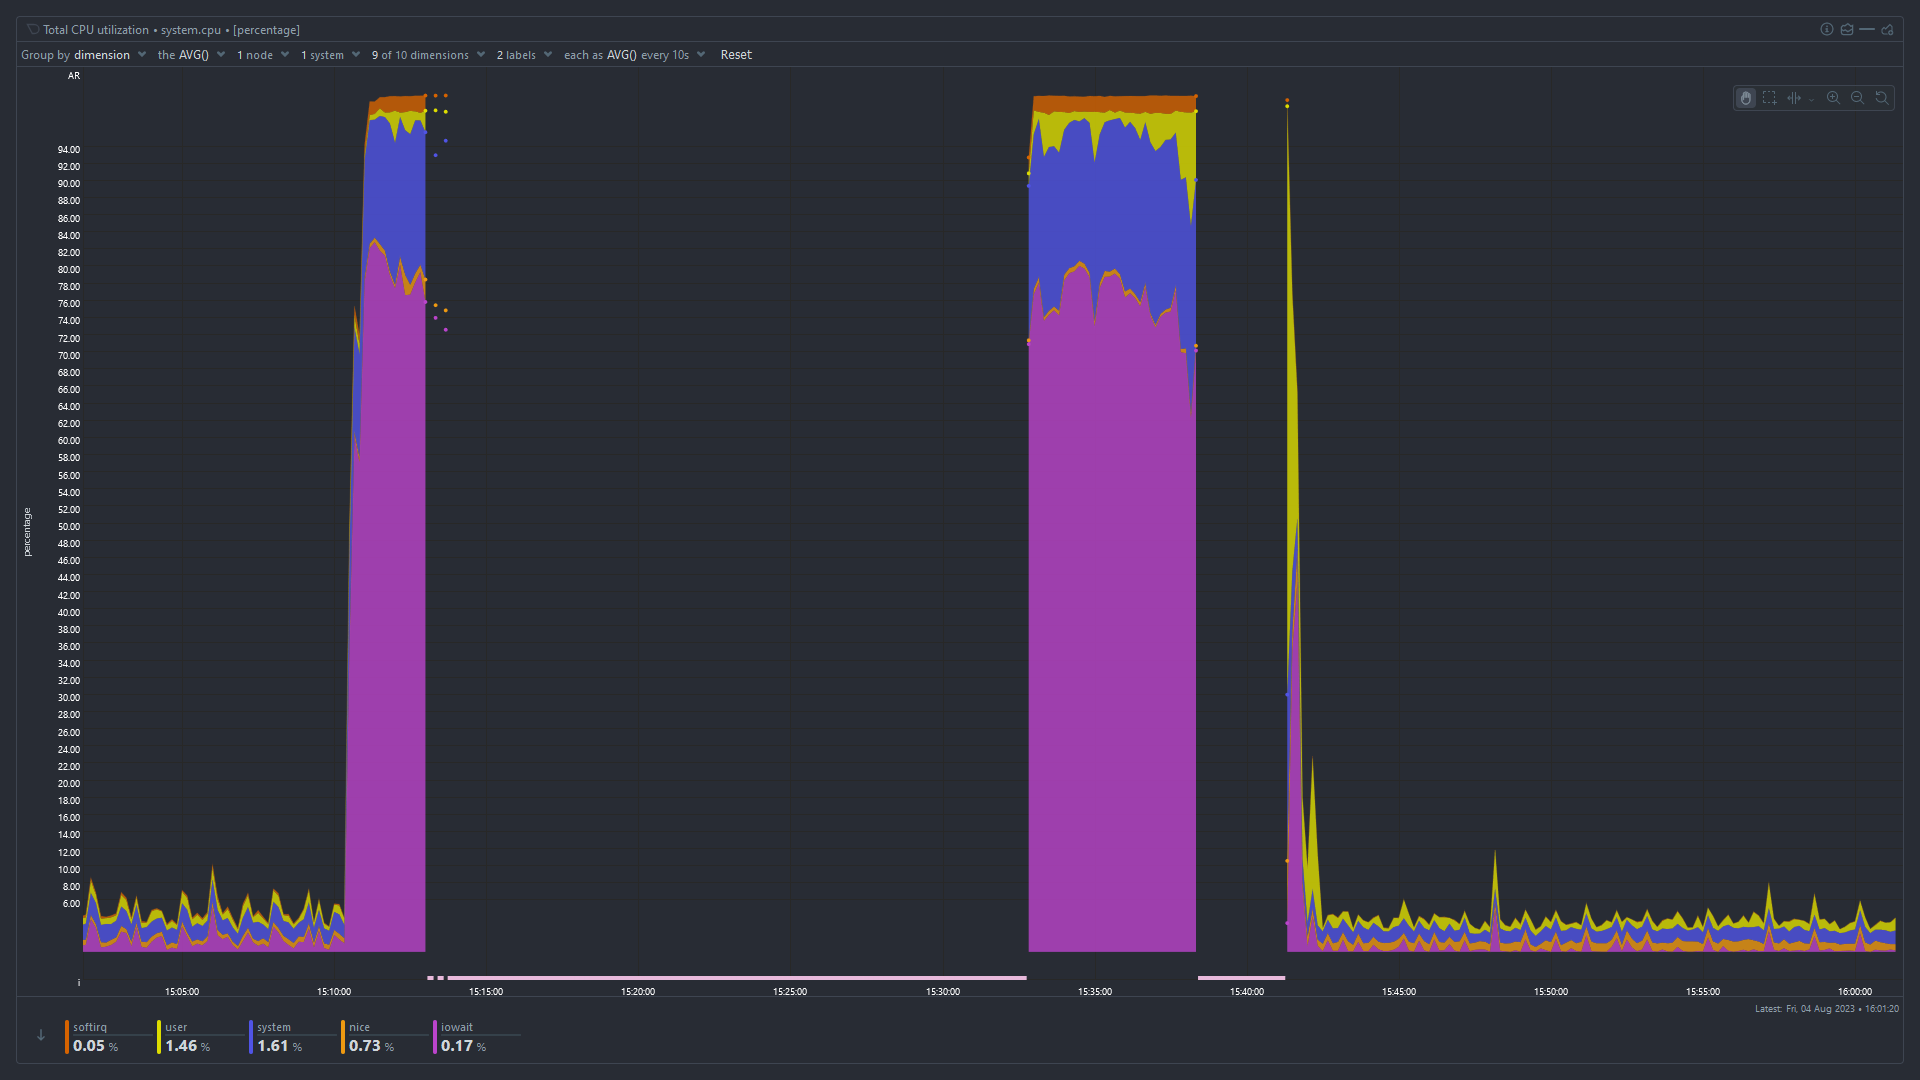
Total CPU Utilization
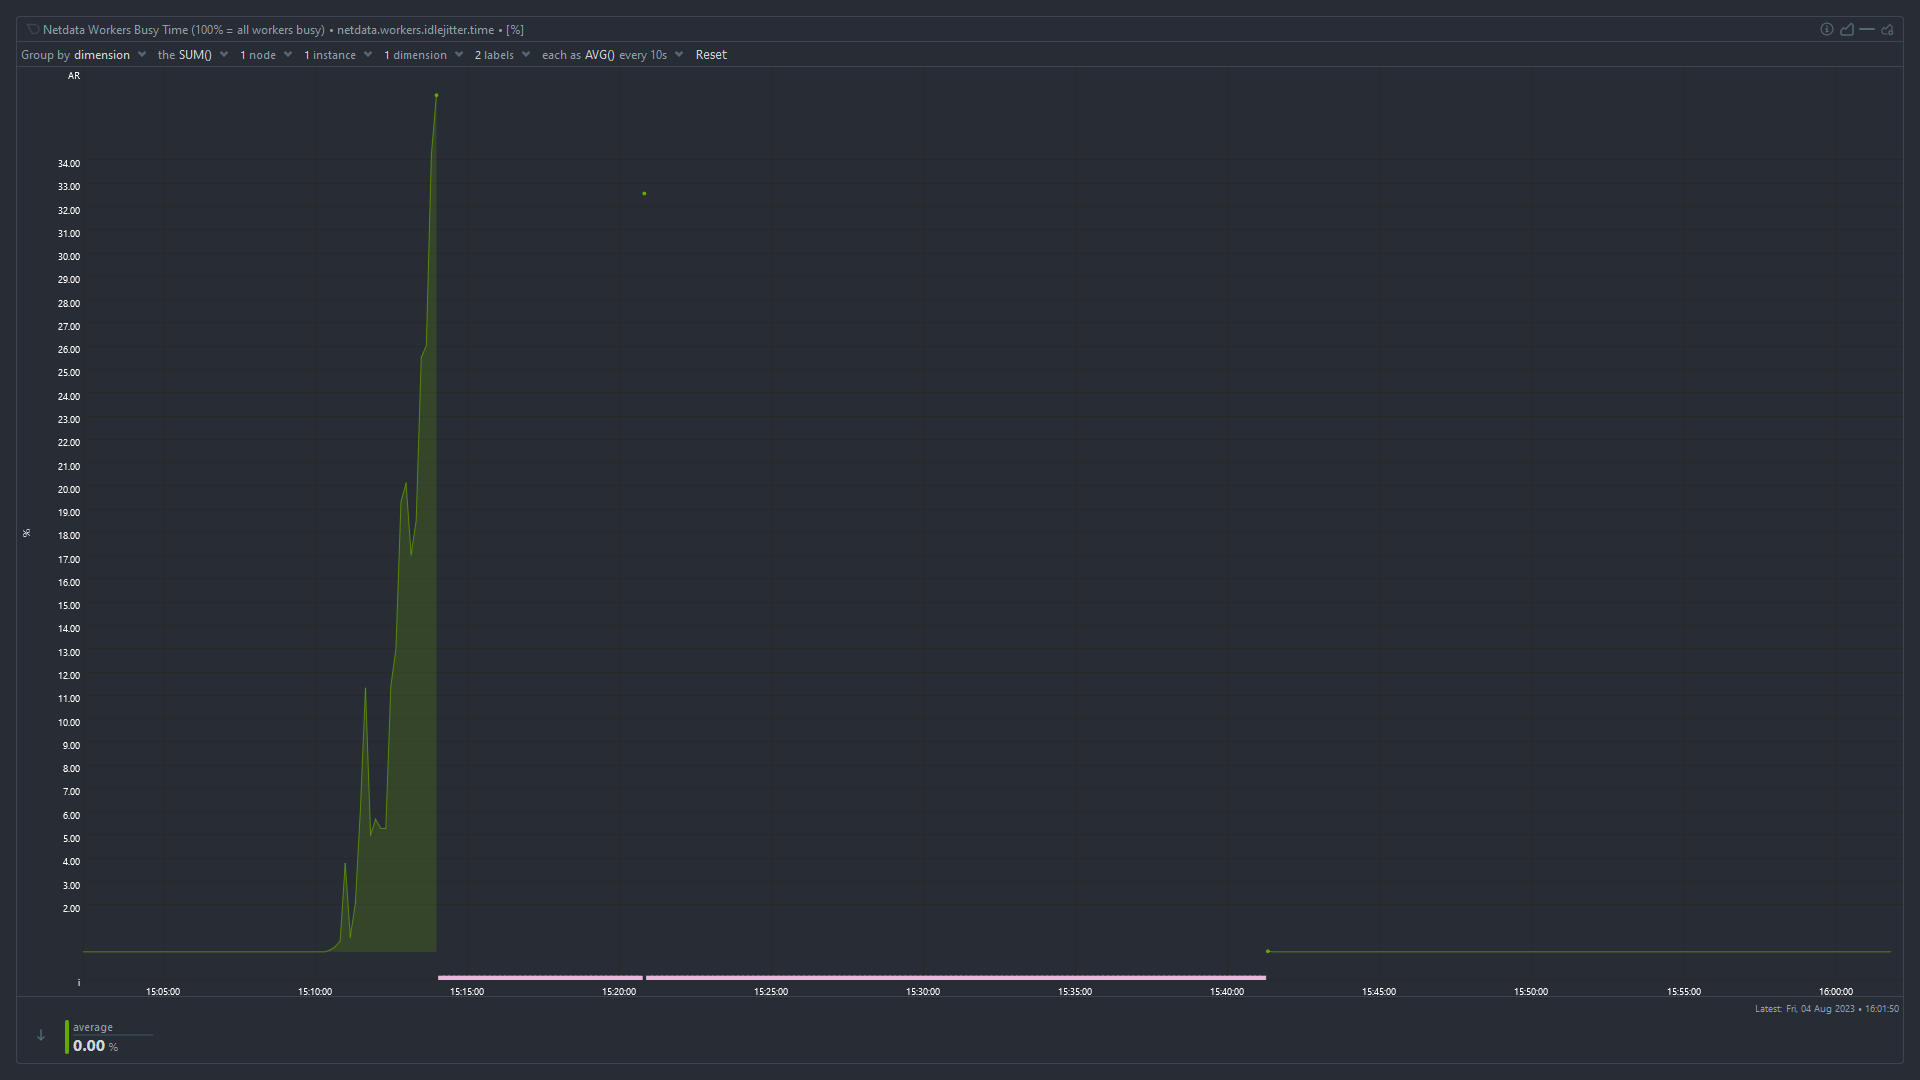
Idle Jitter
High iowait and high used memory suggest that something has used up all the available memory and the system is swapping like mad to stay alive. I’m surprised the OOMKiller hasn’t intervened at that point.
You need to monitor which process is using all the memory. The easiest way is probably to keep
htoprunning in ascreenortmuxsession, periodically connect, and look at which processes have the highest used memory.Superb. I will do that. Would increasing ram Capacity solve the issue? Also, does High IO wait time indicate issue with the boot drive (which is an SSD that is 4 years old)
Would increasing ram Capacity solve the issue?
It depends whether the problem is that you don’t have enough RAM, or something is using more RAM than it should. In my experience it’s almost always the latter.
Also, does High IO wait time indicate issue with the boot drive (which is an SSD that is 4 years old)
No, it means the CPU is waiting for disk I/O to complete before it can work on tasks. When available RAM is low, pages get swapped out to disk and need to be swapped back in before the CPU can use them. It could also be an application that’s reading and writing a huge amount from/to disk or the network, but given the high memory usage I’d start looking there.
Okay. Thanks for the insight. Planning to do this:
You need to monitor which process is using all the memory. The easiest way is probably to keep
htoprunning in ascreenortmuxsession, periodically connect, and look at which processes have the highest used memory.Will report back with findings when it crashes again. Thanks for all the help.
It’ll probably be obvious before it crashes, you can see in the graphs that the “used” memory is increasing steadily after a reboot. Take a look now and see which process is causing that.
Difficult to read the graph, but looks like you have less than 4GB ram. Depending what sort of OS and services are running (from above suggestions), this is likely the biggest issue.
You haven’t mentioned which services you’re running, but 4GB might be enough perhaps for a basic OS with NAS file share services. But anything heavier, like running Container services will eat that up. You’d want at least 8GB.
Note also that you may not have a dedicated graphics card? If you have integrated graphics, some ram is taken from System and shared with the GPU. If you’re just running command line, you might eke out a little more RAM for system by reducing the VRAM allocation in your BIOS. See: https://en.m.wikipedia.org/wiki/Shared_graphics_memory
look at which processes have the highest used memory
You can also do that from the
Applicationsmenu in netdata,memchart.I would also check the swap usage chart, I also think parent poster is correct and you are running into memory exhaustion, systems suddenly starts swapping like mad, disk I/O spikes, causing general unreponsiveness.
. The easiest way is probably to keep htop running in a screen or tmux session, periodically connect, and look at which processes have the highest used memory.
The easiest way is to disable swap and then see what is killed by the OOM killer.
Disagree, oom likes to kill random processes, not just the ones consuming memory.
OOM usually kills the biggest processes. This might not be the process requesting more memory at the time the OOM killer becomes active but it is always a process consuming a lot of memory, never a small one (unless there are only small ones).
I’ve had oom kill ssh or mysql because tomcat is a piece of shit. It’s not always correct.
The OOM killer kills processes, not the kernel. You might be thinking of a kernel panic.
I think your best bet would be to try and capture a log or do some monitoring to see which specific tasks are using a lot of resources at that time. That will give you more insight into what’s going on. You could do that with a command like
htop- https://htop.devDoes it happen on a set interval or is it random? If it’s an interval that seems to have a pattern, you could have a service running that is doing some sort of maintenance task, or has some cron job.
It’s random. I will try to monitor specific processes/tasks to check the resource usage. Maybe HTOP would help. I will report the findings once I am able to track it.
As suggested by others, your processes may be using too much memory. However I would also suggest you keep an eye on the output of
dmesg. Maybe one of your disks is failing.It looks like system is thrashing. Because of the high disk usage and very low amount of physical memory available previous the incident. Look what
dmesgsays. Maybe you’ll see some OOM errors.The solution, I believe, should be to limit the amount of resources your services can use. In their config or something, or put them inside containers with limited amount of memory, or migrate one of the services to other machine.
limit
I was using docker containers. I set appropriate ram usage limits in docker-compose files now. Lets see how it turns out.
I don’t see a clear indication that you have too low RAM… RAM should be “used” fully at all times and your “cached” RAM value suggest you still have quite a bunch of RAM that could potentially be consumed by applications when they need it.
I cannot clearly see a swap usage in the graphs - that would be an interesting value to judge the overall stability of the system with regards to fluctuating RAM usage.However, once you notice the problem again, right after you manage to log in, run a “dmesg -T | grep -i oom” and see if any processes get killed due to temporarily spiking RAM consumption. If you’re lucky that command might lend some insight even now still.
Also, what if you run a “top” command for a while, what’s the value for “wa” in the second line like? “wa” stands for I/O wait and if that value is anything above 5 it might indicate that your CPU is being bottlenecked by for instance hard disk speed.
Before it was rebooted the “cached” value (blue) was very small and decreasing. It goes back to normal after a reboot. I think tmpfs is included in “cached” as well, so it may be effectively zero.
You’re right - I missed that detail. From the graphs alone it looks as if a process ate up all still free to claim (cached) memory, then the system stalled possibly thrashing until OOM kill intervened - as indicated by large chunks of RAM being freed. Allocated RAM in red lowering and cached RAM in blue rising again.
@WhyAUsername_1 Which OS is this? and can you share the important specs of the box?
spec
Updated the post to show the specs. Also pasted below.
@WhyAUsername_1 Thanks!
I recently had a similar experience with one of my boxes… similar specs also. Im my case it turned out to be a disk going bad. Unfortunately It was the one / was on.
It did take a while to figure out the problem though, but you may want to take a look at the
atoptool. If anything, it will help you rule out disk issues.
deleted by creator