@[email protected] to [email protected] • 7 months agoClimate Rulesh.itjust.worksimagemessage-square34fedilinkarrow-up1268arrow-down11
arrow-up1267arrow-down1imageClimate Rulesh.itjust.works@[email protected] to [email protected] • 7 months agomessage-square34fedilink
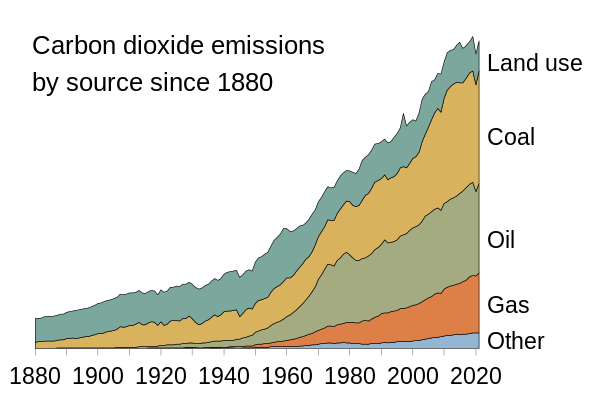
minus-square@Wilzaxlink2•7 months agoYou lose accuracy if you show addition of components on a log scale, so if true this is a terrible graph
minus-square@[email protected]linkfedilink8•7 months agoMakes sense. We haven’t yet made it since the great plague, I guess, to decrease the amount of carbon dioxide in the atmosphere.

Now the fun part: guess the y-axis
log(something)?
You lose accuracy if you show addition of components on a log scale, so if true this is a terrible graph
log(log(something))?
Annually (Gt/a) or total (Gt).
Annual, since there are occasional drops
Makes sense. We haven’t yet made it since the great plague, I guess, to decrease the amount of carbon dioxide in the atmosphere.