

Two-thirds of straight women and one-third of straight men are unwilling to date a bisexual person of the opposite sex, according to a YouGov poll published today, during Bisexuality Visibility Week. The poll illustrates how lingering stereotypes negatively affect people’s impressions of bisexual individuals.
The poll — which surveyed 5,983 Britons during late March, including 2,031 straight women and 1,517 straight men — found that 48% of all respondents had positive views of bisexual people and only 8% had negative views. The remaining percentage had neither a positive nor a negative view of bisexuals.
…
When the survey asked straight women and men why they were unwilling to date a bisexual person of the opposite sex, most (16% and 19%, respectively) said they “just don’t” or claimed, “It’s just a preference.”
A nearly similar portion, 17% of straight women and 16% of straight men, said they felt like bi people are more inclined to cheat, or that they themselves would feel insecure that they’d be unable to provide a bi partner whatever they get from a same-sex partner.
Interestingly, 9% of straight women said they feel disgust or discomfort towards men with same-sex experiences, 8% worried about possible sexual health risks, and 10% of straight men said they considered bisexuality to be either religiously or morally “wrong.” Approximately 12-13% of all straight respondents said they just wanted their dating partner to be heterosexual.
But the numbers are almost same order of magnitude, is it really that bad?
Scientifically, sample sizes aren’t validated by commonality, but by statistical significance. If it had been 10,000 of each we might be onto something. And if the amount of people polled in total was a million or so then we’d have something we could call “a trend.”
Hmm, typically polls are on the order of magnitude thousands, and are considered statistically significant. See e.g. Wikipedia:
They have the maths in there, you can check it out. I understand that these seem like ridiculously small numbers for e.g. a physicist, but that’s how different fields work.
when there are almost 8 billion people on the earth, a poll of around 0.0001% of them seems a bit dodgy, however I’m also a realist and know a poll of over a million is just logistically unfeasable. At least 10K seems a reasonable compromise.
The interesting thing is that the absolute size of your population doesn’t really matter when you’re investigating percentages.
Let’s say 25% of an infinite number of people prefers cats to dogs. If you had a perfect sample, you in principle only need to ask four people and you’d have the right answer.
From there, we only need to increase the sample size to account for the fact that we don’t have a perfect sample. You need to be careful that you don’t only ask people in the dog loving society, but once you’ve asked around a 1000 people that you’re pretty represent a broad segment of the population, you can do the math and show that you’re confident within a relatively narrow error margin.
Edit: there’s a cute analogy you can think of: a cook wants to know if his soup is salty enough. Even if it’s a huge pot of soup, he only needs to taste a spoonful to know.
Funny you make that analogy because I am a cook by trade and I can tell you that this is hogwash. Unless the soup is thoroughly mixed you’d never know. The bottom of the pot could be saltier than the top. Also suppose the soup has already been served mostly. That soup may have had thousands of carrot pieces in it, but you’d never know it just by looking at the last cup or so of it because they were all served out with other bowls. Large sample size rules out X factors like that.
Exactly! That’s why you put in all the work to find a representative sample. The more representative it is, the smaller it can be. But this is not something you get for free, this is what the polling institutes put so much effort into.
In the analogy, that corresponds to stirring after adding the salt. If you’ve stirred well, you could by some statistical anomaly still end up with a spoonful of soup that’s way less or more salty than the average, but that chance can be measured by the margin of error.
When accounting preferences, attractions, and other subjective information, you have to have varied sample sizes in order see if patterns are observable. In this sham of a study, for every lesbian, 2.3 gaymen answered, 2.5 bisexual women answered, an marginally slightly more bisexual men answered. Meanwhile 5.8 many more straight women answered, than straight men: 4.3.
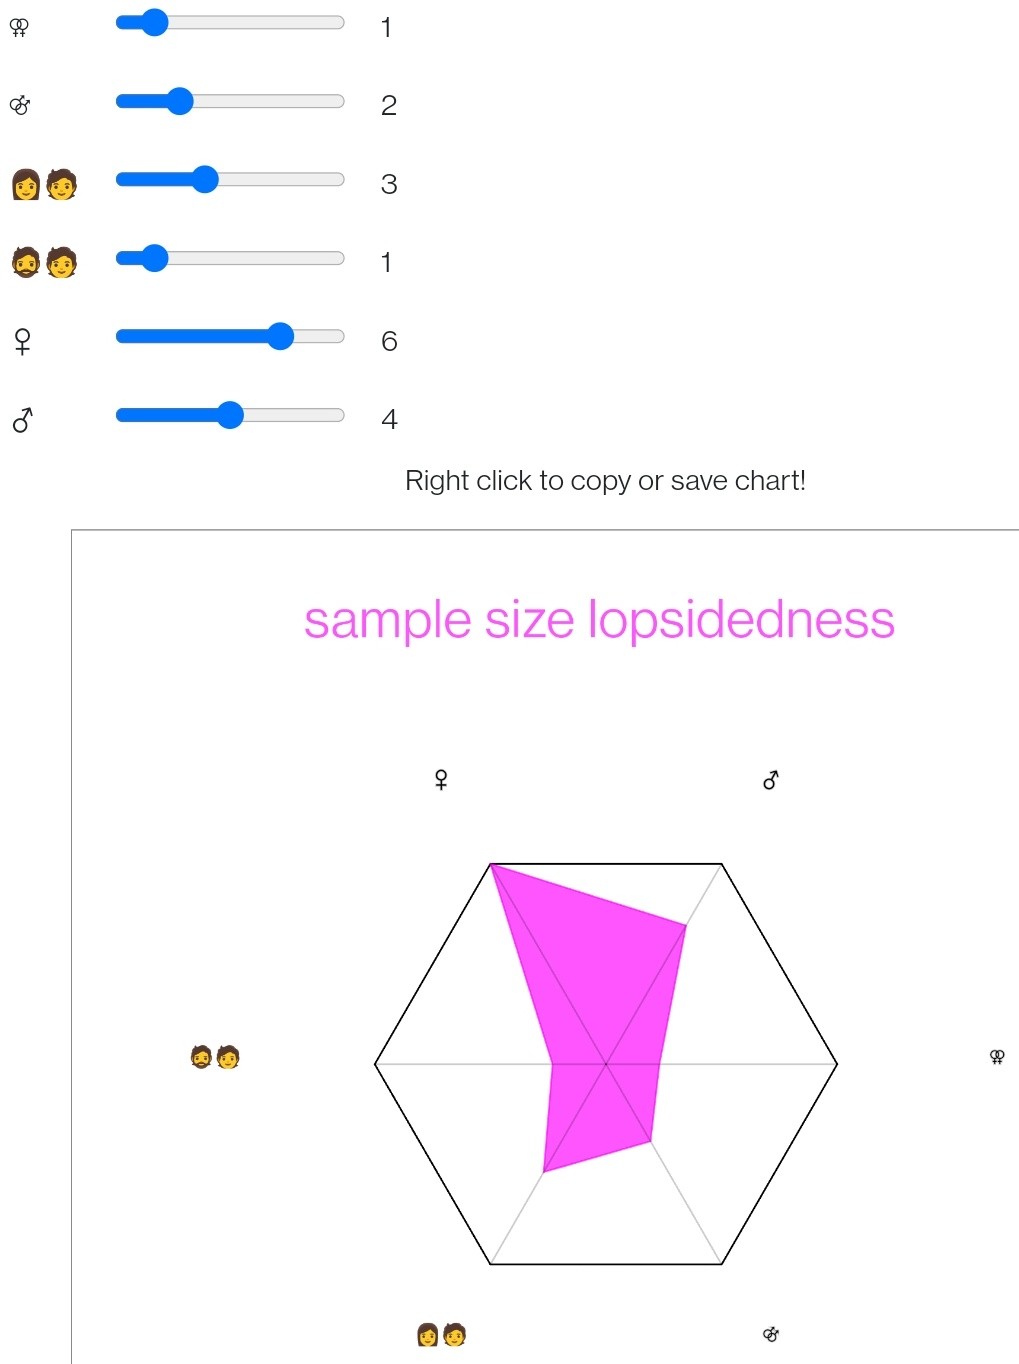
If this was supposed to be a hexagon, is not lopsided?
Having uneven sample sizes between populations is not a problem, provided that you have a reasonable number of samples from each population, and provided that you don’t do something silly like comparing raw counts. Regardless of sample size you of course also need your samples to be representative of the populations they are drawn from, but that’s a basic prerequisite for any meaningful statistics.
The results of this particular survey is presented in percentages, so unless the samples are highly unrepresentative the numbers are not going to change much by increasing the number of gay, lesbian, and bisexual individuals to match the number of straight individuals. You’d just be narrowing the margin of error a bit, but those should already be decent for these sample sizes: https://www.calculator.net/sample-size-calculator.html
If I ran you calculator correctly, I only need 25 bisexuals to answer for 72 million britons?
Without knowing the exact values you entered, I’m guessing that you calculated the number of samples needed to estimate proportion of bisexuals in the population +/- 5%. In other words, your survey with 25 random British individuals would net you an estimate of bisexual Britons in the range 0 to 6%.
In the context of this survey, you need a sample size of about 400 to get a 5% margin of error for the answers from the surveyed bisexual Britons, meaning that if 20% of those 400 British bisexuals answer “yes” to a survey questions, then the actual percentage (i.e. if you literally asked every British bisexual) is expected to be in the range 15% to 25%. YouGov has an article that it explains it better than I can: https://yougov.com/articles/2497-understanding-margin-error
I assume the calculator follows this math, you can check it if you want to understand better.
No. Liberal arts majors say all kinds of dumb shit about sample sizes.