
- cross-posted to:
- housing_bubble_2
You must log in or register to comment.
That can’t be right though… 1000 people isn’t nearly enough to drag the average income down 5k BELOW the median income in a nation of over 300 million. It should still be higher due to the long tail on the high side of incomes.
Proof: Average income in top 1% is 819k https://www.unbiased.com/discover/banking/how-much-income-puts-you-in-the-top-1-5-or-10#:~:text=To be in the top 1%25 of earners%2C you’,earn%20an%20average%20of%20%243%2C312%2C693.
Solve the weighted average:
819 * 0.01 + x*0.99 = 74.5
Where x is the remaining average. X≈66.3k, and that’s excluding the ENTIRE 1% which is over a MILLION people at least, depending on how you count it. America is big.
I guess the lesson here is don’t trust unsourced factual claims in political memes because they are probably just made up
Anime girls will never lie to you.
Wrong, they will always lie to you.
Wrong, there are two of them. One always lies and the other always tells the truth.
You mean information on an obvious anti-US propaganda community might not be particularly high quality?
86% of statistics quoted on the internet are made up.
Yep. And never trust information embedded in a jpeg if it doesn’t include a source!
Yeah, these numbers don’t make sense.
To explain the first panel alone, by removing the top ten earners from the data set, you’d move the median to.the lower end by 5 “slots”. I’m confident that there are more than 100 people in the USA who make between $65k and $75k (I know at least 25).
If they mean the average/mean, that still doesn’t add up. Assuming that the US population is about 350 million and that 350,000,000 - 10 ~= 350 million.
NGL, formatting the equations and walking then out step by step is a pain, esp on mobile, but the answer I came to is by multiplying the difference in mean values (~$10,000) by the US Population (350 million), which yields $300,000,000,000 or about 10 billion per person once evenly distributed.
Elon Musk (2nd richest man in the world at time of writing) has a net worth of less than $5 billion rn, but the numbers here imply that the top earners in the US made at least 60x that amount.
TL;DR: I’mma need some sources on this.
Edit: on my app (Voyager/Wefwef) I can’t save draft comments to go look at the meme while commenting, so definitely have some things off from.what the meme was saying, but they’re close enough I’m leaving as it.
Also, spelling/grammar
Your slot argument only makes sense for median, when the picture is about means. I still think it’s off though.
Yeah, I def misread the original meme, but was too committed to the comment when I wanted to.double check somethings.
I use Voyager/WefWef or browsing Lemmy and (to the beat of my knowledge) don’t have a way to save draft comments while double checking the content I’m commenting on. I suppose I should probably make an edit addressing this…
When that would happen to me while using rif to browse Reddit, I would use copy/paste to “save” what I had written while I reread the post.
Ugh, yeah, but it just gets so tedious.
Besides, I figure it doesn’t matter since we’re all just bots talking to bots. /s
Is that supposed to be a net annual income for Elon rather than a net worth? His net worth 270 billion.
deleted by creator
But I think this is only about wages right? It doesn’t take into account growth in net worth based on shares, does it?
“Income” is understood to mean wages in measurements like this.
Not sure about this. However if this was the case, income would be a pretty useless term in terms of describing financial inequality, as a lot of wealth gained would be excluded by this definition.
deleted by creator
You might be underestimating the wealth of the top 10.
Exactly my first thoughts but then I remembered it’s Lemmy. These morons operate on the “trust me, bro” system 🤣
Given the comments in this very thread, that doesn’t appear to be accurate. I only opened this thread because I suspected inaccurate data.
Ackchyually ☝️🤓
🤨 you good?
Judging by their recent comments, no no they are not
Yeesh. They’ve got a struggling mind.
This is also why the publiclly discussed focus is on household income, which is mostly two incomes. Prior to the 80s single income housholds were the majority.
Maybe more than 2 when you add in the children!
I always assumed in the US “household income” went off tax filings, so it would only be individuals, or married filing jointly
Household
Definition
A household includes all the people who occupy a housing unit (such as a house or apartment) as their usual place of residence.
A household includes the related family members and all the unrelated people, if any, such as lodgers, foster children, wards, or employees who share the housing unit. A person living alone in a housing unit, or a group of unrelated people sharing a housing unit such as partners or roomers, is also counted as a household. The count of households excludes group quarters. There are two major categories of households, “family” and “nonfamily.”
Household is a standard item in Census Bureau population tables. source
It’s physical building or apartment people live in. 4 individual single tax filing roommates count as a household.
Remember kids, always account for outliers in your datasets and also eat the rich.
Or don’t. Worst kind of food poisoning. Bioreactors are safer.
Is this fact/accurate??
Excluding top 1000 drops the average in half??
Definitely a reason to only ever use median instead.
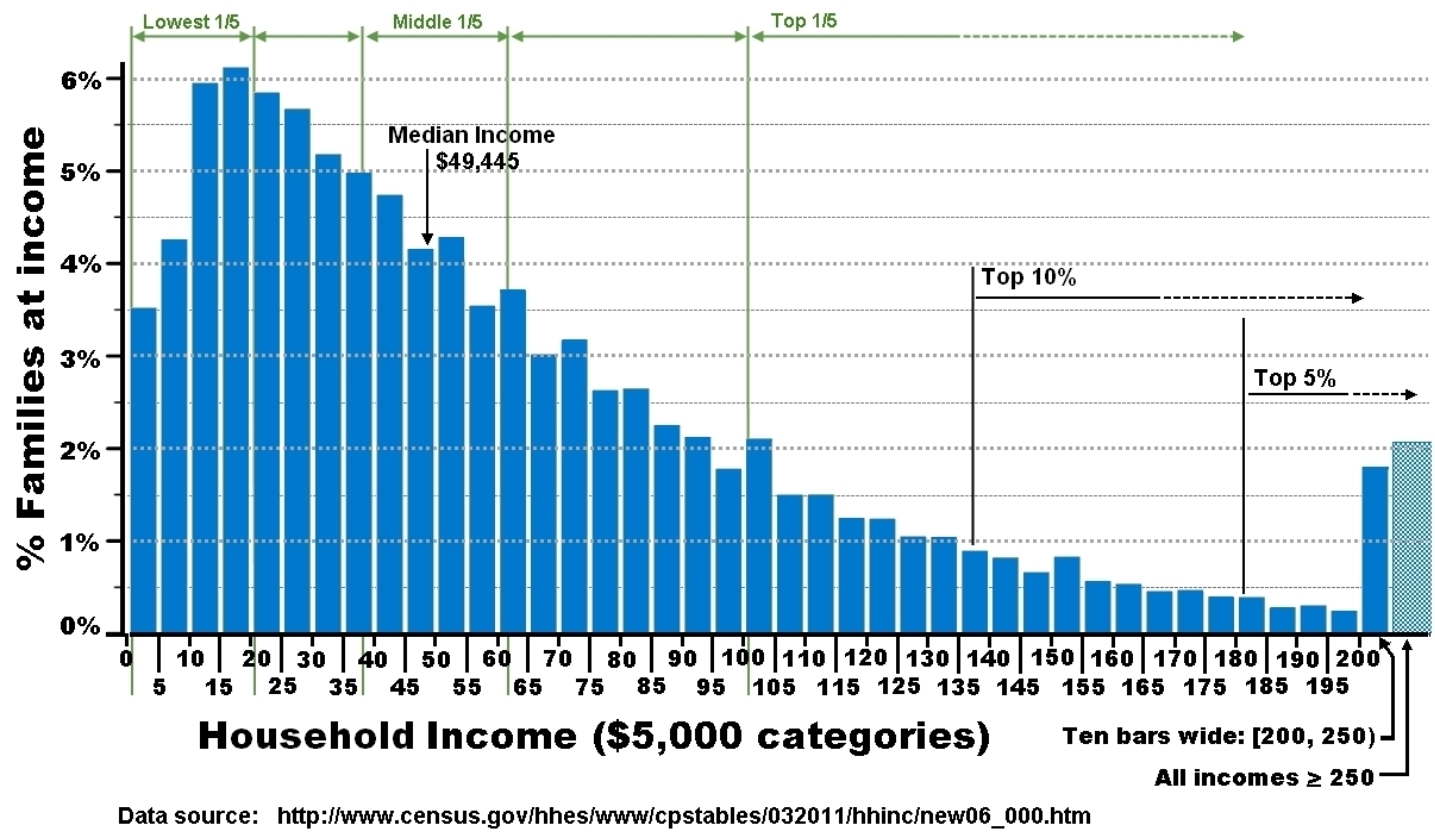
Median is the middle point of the population and has its place when the range doesn’t skew too much. I think a good representation of income is by percentages, as in “90% of people make $x,000 or below”. This chart had dated (2010) data but its a better representation than I’ve found elsewhere
Massive skews and tails are why you use median.
Its median is tool for understanding data but it doesn’t paint a complete picture and can’t be representative without other context. For example, if you have a bimodal distribution, the median doesn’t tell you much just how like the average doesn’t tell you much. There are other examples like this.
what? the mode is $15k/yr?
15-19, yeah. I pegged it a little higher from what I was able to gather, around 23k. Some of that is just how the data is displayed though. Here at 5k it’s entirely likely that you’re seeing the federal minimum wage outweigh other factors, (7.25*2080=15,080). By fifths and quartiles it can come in a bit higher, but always below the median. And I don’t think that gets nearly enough attention.
Whole lot of wage theft going on.
Thanks. That graph shows the Mode, which skews even lower.
Nah there’s no way this is accurate.
Median simply eliminates outliers. If the picture is true, the median should be around 35k
For what it’s worth, AI models are saying just excluding the top 10 wealthiest Americans actually drops it from 68,700 to around 40,000 based on data from 2020.
Take this with a giant shovel of salt… But it does kind of corroborate the numbers presented.
Makes sense 36,000. 8K goes to taxes. End up with 28,000 for my entire life for a year. And I work very hard
5k if you’re single. 3.5k if you’re married. In PA at least. Not sure where you live but your numbers seem extreme.
For the second frame of this to be true, assuming 157 million working Americans, each of the top 10 earners would be making over $150 billion a year on average. This amount is close to the net worth of the world’s richest people, and couldn’t possibly be their annual income.
edit: fixed error
What? The world’s richest people are not in the 1,5 billion dollars range. They are in the 200-100 billion dollars. And it would be surprising if they didn’t earn 150 million just from owning this amount of wealth each year.
Sorry, I meant to write $150 billion a year, not $150 million.
The rich are consolidating the market and republicans are too busy incorrectly blaming Joe Biden who is trying to support labor by implementing safety measures and holding businesses accountable.
You say this as if it’s accidental
It’s only accidental when the poor and uneducated republicans do it
I see lots of people are pointing out that these numbers don’t make sense. Here are some of my thoughts.
I’m not an economist so I’m probably making some very basic mistakes but…
GDP per capita is $76.3k [Google] Average household size 2.6. [Google] So GDP per household is $198.4k [Calculator]
That is the mean productivity per household.
But the median income per household is $75k [Google]
So what happens to the $123.4k of productivity (198.4k-75k) per household that isn’t paid to workers? It’s in the outliers and is asset appreciation isn’t it?
very disinfectant mistakes
I’m staring at this trying to figure out if autocorrect did you wrong and if it did, what was it originally
PS: A very disinfectant mistake

Mt dew in the cup on the right. Windex in the cup on the left. They used different amounts of ice to balance the colors.
What if they let the Dew go flat and carbonated the Windex?
Inconceivable!
Yeah I had to replace my phone’s screen and the digitizer has never been the same. I’ve corrected it to something sensible, I’m not sure what my original word choice was though.
Dont know if i dont get the sarcasm. But why are you using the household size? Why is everybody in the household working fulltime? I would think the >2 household are the kids :D
I used median household income to account for the fact that not every person in a household is earning. I wasn’t confident that median individual earnings would include people that aren’t earning.
Guys, stop trying to figure out the average. You guys should look for the mode (the most common income, not all income added and divided).
Edit: If anyone has the mode for american income, I’d love to hear it. I can’t find it. Just the median and average.
the mode is probably 0.
e.g. there are plenty of people with exactly 0 income. there are few people with exactly another income.
Yup, Wikipedia says all exponential distributions have mode 0
It might work a bit better if incomes were bucketed into 5k brackets before taking the mode. From there, I guess you can take the mean or median of all the incomes that comprise the bucket?
It would still always be the lowest bracket, because most people make little and few people make much.
If you look at the horizontal lines here you get 50k brackets:
https://fourpillarfreedom.com/wp-content/uploads/2018/11/ind_inc0-1.jpgThe first bracket is ~65% of the population, the second bracket ~25%, the third bracket ~5%
Maybe as a rule of thumb it would always be the lowest bracket for the US. I live in the Netherlands, and the mode here is as a rule of thumb about 79% of the average. This gives a mode of 44000 euros annually. So it doesn’t have to be the lowest bracket.
Well, that’s depressing.
That’s not helpful though.

Got this from a thread further up. This seems to indicate that the national Mode is $15k - $20k
Isn’t this different for each state?
Yes. That’s another good thing to get into. If you have the resources, please do everything you can to bring wealth inequality into the limelite.
Sauce?
https://www.statista.com/statistics/203183/percentage-distribution-of-household-income-in-the-us/
Keep in mind that household income really means 2 income sources, not average American income
Thats not the source of any of the stats in the meme though? There’s no way the average income outside of the top 1000 is that low. Heck, that’s not even a large proportion of “the 1%”
 Median individual income just over 40k in 2022
That’s probably the number that includes people that don’t work though… all the income numbers would shift down in that case
That’s generally excluded and even if it’s not unemployment has been very low recently
The problem with the unemployment statistic is that it doesn’t include most people we would consider unemployed. If a person hasn’t actively been job searching in the past four weeks, they are not counted. Therefore it does not count prisoners, full-time students, retirees, most of the homeless, etc.
Yeah I’m seeing 40k but a bunch of other numbers as well, some above 50k. It really comes down to how you measure it but in any case the numbers in the meme don’t make sense.
BTW though unemployment is not the same as number of people not working. It refers just to people actively looking for a job that aren’t employed.
I think it’s just hyperbole. The median numbers are accurate enough even if meme was made 5 years ago
Considering none of images include year information, the figures are rounded to even 0s, and the fact that it’s a meme…
It’s more than close enough. We’re arguing peanuts here, the premise of the meme is factual and backed by the data. But I admire your quest for truth and precision
Nah it’s not even CLOSE to true though, that’s what I’m trying to say haha. The influence of the top 1000 on average income is off by at least an order of magnitude, probably more. I don’t like it when people double down on false information by saying “well it still makes a good point/it might as well be true/I would totally believe it if it actually happened”
… the premise is that the upper class weigh heavily on the national average.
Aquila showed you that it was still around 40k.
Which you tried to disarm by saying that you found that number, 50k and other numbers without any sources.
Census.gov says median household income was 74k which is right around 35-40k per person when considering household income as 2 sources of income.
I don’t like when people try to distract, dismay, divide relevant talking points for the upcoming election.
Which is why it’s vital to know the pitfalls of statistics.
Averages aren’t a baseline, and understanding the data’s intricacies is pivotal to good stats.
Anytime there’s generalizations, especially as they grow in size, you’re discounting the little guy, and the devil is in the details.
deleted by creator
Oh yeah? what happens if you exclude the bottom 1,000? 😏
This, ladies, gentlemen, & all other variadic param[] of polymorphic gender identifier: average is just about useless when your income distribution is skewed to hell.
The following elaboration of ‘skewed to hell’ brought to you by our grammatical sponsor(s) who felt a single sentence would be asking a bit much:
- skewed to hell:
- much like a contemporary Big Box Home Improvement™ 2x4†,
- even after you have laboriously picked through the entire 2 pallets of this week’s pathetic delivery of stock,
- each one weighing as much as an Olympic bar (~45 pounds for the metric challenged),
- overladen with pumped-up moisture content,
- with employees giving you the stink-eye because their boss is the assistant viceroy to the vice-supervisor II who reports ‘directly’ to the district junior manager of "end-cap yo’ ass from on high I crave the retail facing’,
- trying in vain to select the most choice and optimal specimens,
- still ending up not being able to see anything but sap, knots, and disappointment as you look down the length,
- as you strain to assess its deviation from a long-lost baseline against the fluorescent lights,
- activating your ADHD superpowers,
- contemplating economic and environmental policy failures of multiple decades,
- questioning your life choices,
- ultimately defending a clumsy attack on your sensibilities by the special human who parked blocking the store entrance and hotdog stand because it can’t be arsed to use a parking spot and would not be qualified to park in the ‘pro contractor’ area anyway as judged by peers
Regardless, the income distribution is about as normal, perky, and bell-shaped as a Petunia in Death Valley.
† Note: 2x4 is given in nominal measurements, not actual dimensions - do your research
You ok? Just getting home from Lowes?
Here’s a tip for you: find a real lumberyard.
That was like reading a Dr. Bronner’s shampoo bottle
ADHD superpowers? My ADHD superpower is staying up (against my will) for 2 days straight half-alive before an important event, but not being able to stay awake past 3 pm when I need to be somewhere at 5 pm. And any amount of sleep/napping below 7 hours somehow making me more tired than I was before
This why statistics are so frustrating you can make them say anything.
Well, not anything… It’s pretty recognized that in most cases, median provides a more realistic and representative measure than average for this very reason (outliers).
The median is an average. It’s less susceptible to skew than the mean, the most commonly used average.
Ok, I see what you mean. In my education, average and mean we’re used interchangeably.
median provides a more realistic and representative measure than average for this very reason (outliers).
Must be a hell of a lot of people earning SO much less than the median wage if the average wage excluding only 1000 out of ~335m is already significantly lower…
Yeh
I wouldn’t be surprised if half of Americans earned less than the median.
The average annual salary in Canada in 2021 was $59,300
The median income in Canada is $68,400, after taxes, according to Statistics Canada’s income survey (2021)
Huh… seems backwards in Canada’s case…
Salary and income are not necessarily the same thing.
Most people’s incomes are not salaries, I’d think.
This website seems to use salary and income interchangeably as if they were the same thing.
I lament statements like this because I work with statistics and you can’t just make them say anything. I hate that people use this to dismiss real facts.
You always have to look at the distribution, which is hard to do well. Simple statistics and averages hide so much detail, it’s often ineptitude more than outright deceit.
You can’t make statistics say anything, I agree. What happens is more sinister - cherry picking, misrepresenting, and falsely comparing statistics.
That does happen a lot unfortunately.
Usually people only want the statistics that confirm their preexisting positions and pick at anything else or ignore it.
This is why words are so frustrating, you can make them say anything.
This is why saying is so wordy, because you can anything make you want
Why waste time say lot word when few do trick?
Why -time by say +word? Punct +better.
+word → -time; punct > word
I would not normally reply to myself but I thought of this after posting and had to share it


