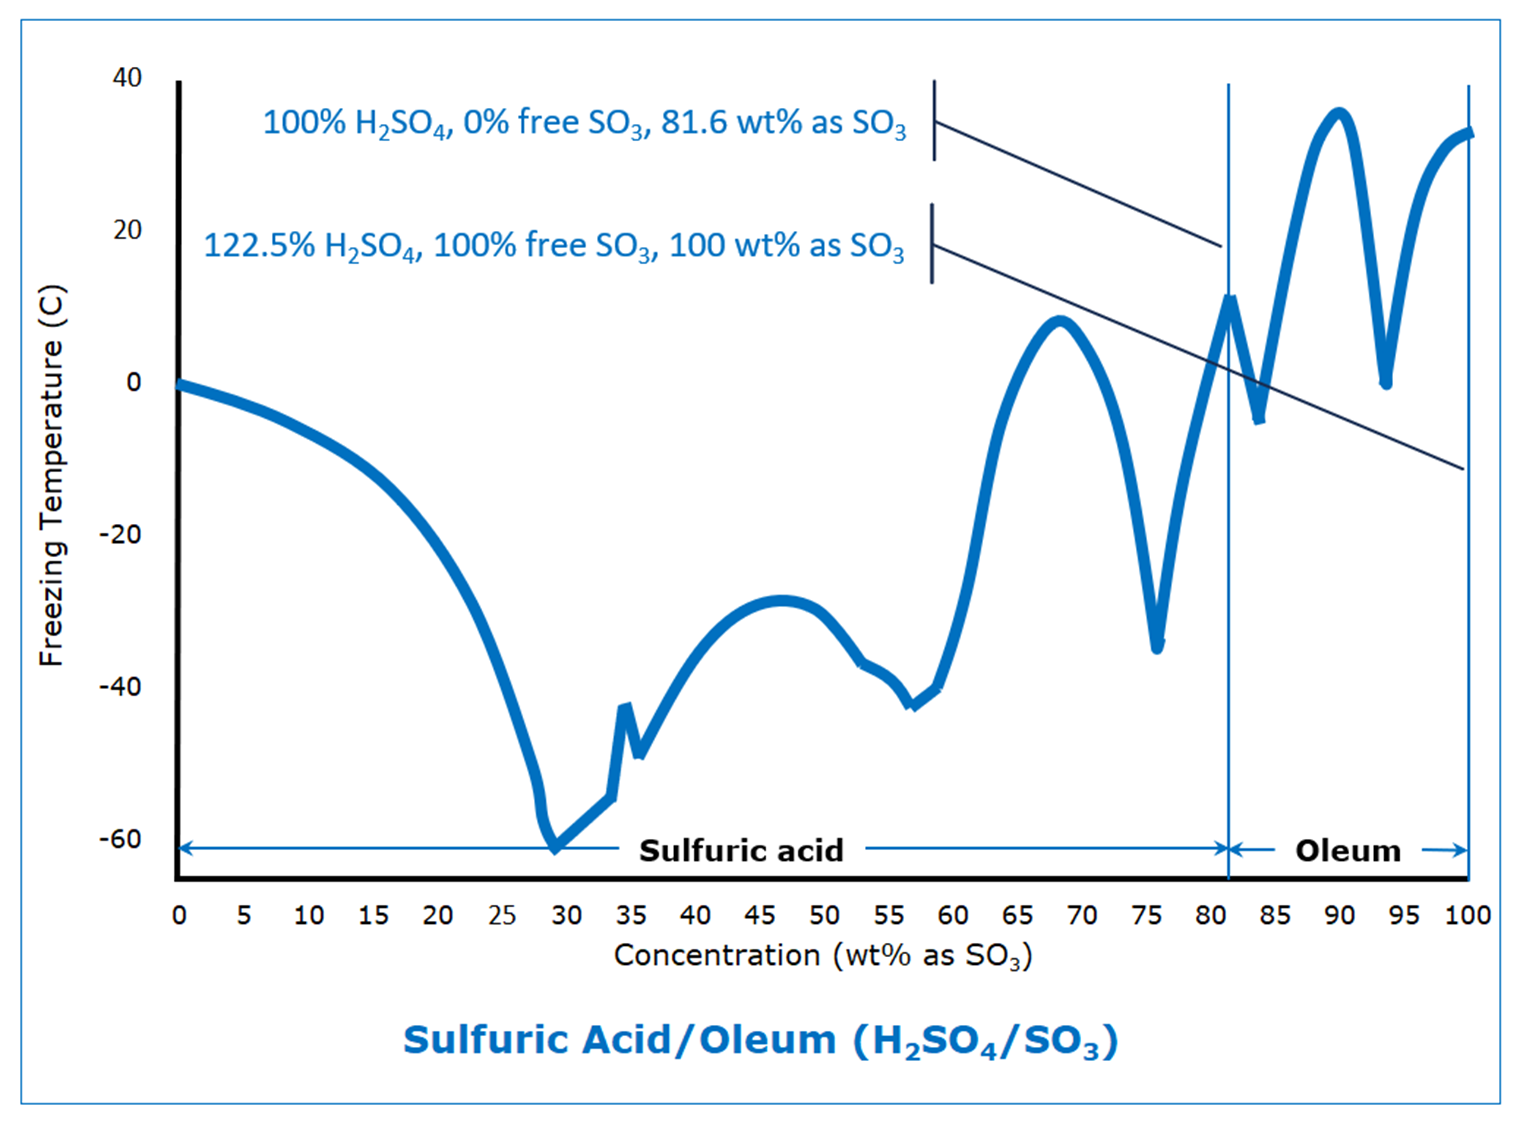
Dare someone smarter than me explain what the ever loving fuck is going on there?
This is what happens when some kind of new compound is formed between these two, here it’ll be series of sulfuric acid-water complexes. Same thing happens with metals when intermetallic compounds form, see titanium-nickel phase diagram. Normal case would be eutectic, see aluminum-silicon phase diagram
I see. So these are actually many sulfuric compounds in a trenchcoat chart.
Some of which are probably only a bit stable and so only exist in a mixture
Never mind between 80 and 90%, WTF is happening at 42.5%‽
There’s a metastable phase somewhere out there and change of the most stable solid phase between 4-hydrate and 6.5-hydrate
My uneducated understanding is that the chart shows at which temperatures sulfuric acid freezes depending on the concentration. Also in my very basic understanding of physics and chemistry I would have thought that it’s linear or exponential or something predictable and not that jumpy.
In normal cases you’d see two curves going away from pure compounds downwards to a common minimum, which is eutectic point. It’s generally only vaguely predictable, but always monotonic
Here’s what a normal curve looks like:
https://i2.wp.com/www.storksplows.com/docs/wp-content/uploads/2017/04/Brine-Pro-salinity-chart.png
Sulfuric acid and water has various H2SO4 and H2O ratios. So like 1 H2SO4 and 6, 3, 2, or 1 H2O it also has just the H2SO4 and H2S2O7. These are present as local points within solutions and with different prominence depending on the amount of water added. These 8 different ratios each have different freezing points.
If I had to guess, I would assume that there are different molecular lattices that sulfuric acid and water can form at different concentrations and that these different lattices have different freezing points. I will now go look it up.
What you’re describing are different crystalline phases of pure compounds, but this does not give you new minima, you need some new compound to form for that
Physics.
That chart stops at 100% what a noob. Back to the lab with ya!

100% concentration is rookie numbers
It could get a lot messier. Adding in a third variable of pressure would’ve made the measurements so much harder.
Would be interesting to use pressure to keep the curve as flat as possible
The graph for that would be wild, presumably. Wouldn’t the axes have to be extremely inconsistent?
Now it’s the Z axis’ time to shine!
Yeah, all the pretenders and management saying if you can’t show it in extreme simplistic elegance you obviously don’t understand it enough. Eat shit.
… what Im saying is that I would just make up my own pretty curve, the scientific community would disagree but the public would accept it & grants would roll my way easier.
Especially that bump right around 42%. You know they retested that multiple times with a “wtf is going on?”
Not only that - you know they still got a bunch of “ok, but are you sure you measured it right” questions even after explaining it all in the paper.
I remember the first time I saw
Newtoniannon-Newtonian fluids in video. I feel like my brain broke. How much more science have I been taught inaccurately?The real world is crazy weird. This multiple freezing points post is also fucking me up too.
Newtonian fluids are just normal fluids, like water. The so not change their viscosity under sheer stress. I assume you mean non-newtonian fluids.
What were you taught wrong about those?
Yeah, you were right. Non-newtonian fuilds messed me up. I saw a gif of liquid that turn more solid when you hit it than if you ease into it. If that makes sense. I was confused by the change in density.
I just didn’t know they existed. Is there a liquid that you could run over as long as you do it quickly?
Yes, that exists. All you need is something that is attracted to itself. So to move it around slowly you only need little force since links can break an reform, but to move it around fast you need to break a lot of links at once. Simply put some starch in water and you have that.
The other way around would be something like toothpaste or ketchup.
Me at my job right now. Apparently titrations and loss on ignition is some of the hardest shit to ever do in science
Titration is hard, I agree. But blowing glass with a custom glass composition is way harder imo
The thing is these are established methods with clear instructions but I can’t get the right numbers for whatever reason it’s really making me question if I’m even a chemist. Blowing glass, now that sounds pretty fucking hard actually
Chemistry and Physics combined make very interesting ‘resonances’ in molecular behaviour. That’s as educated a guess I may make.
Wait until you see phase diagrams for liquids, not to mention liquids with different concentrations.
Or freezing and types of ice formed.


